
Big Picture and Key Takeaway
1st Quarter 2023
(Click Here for Printable PDF)
Key Takeaway
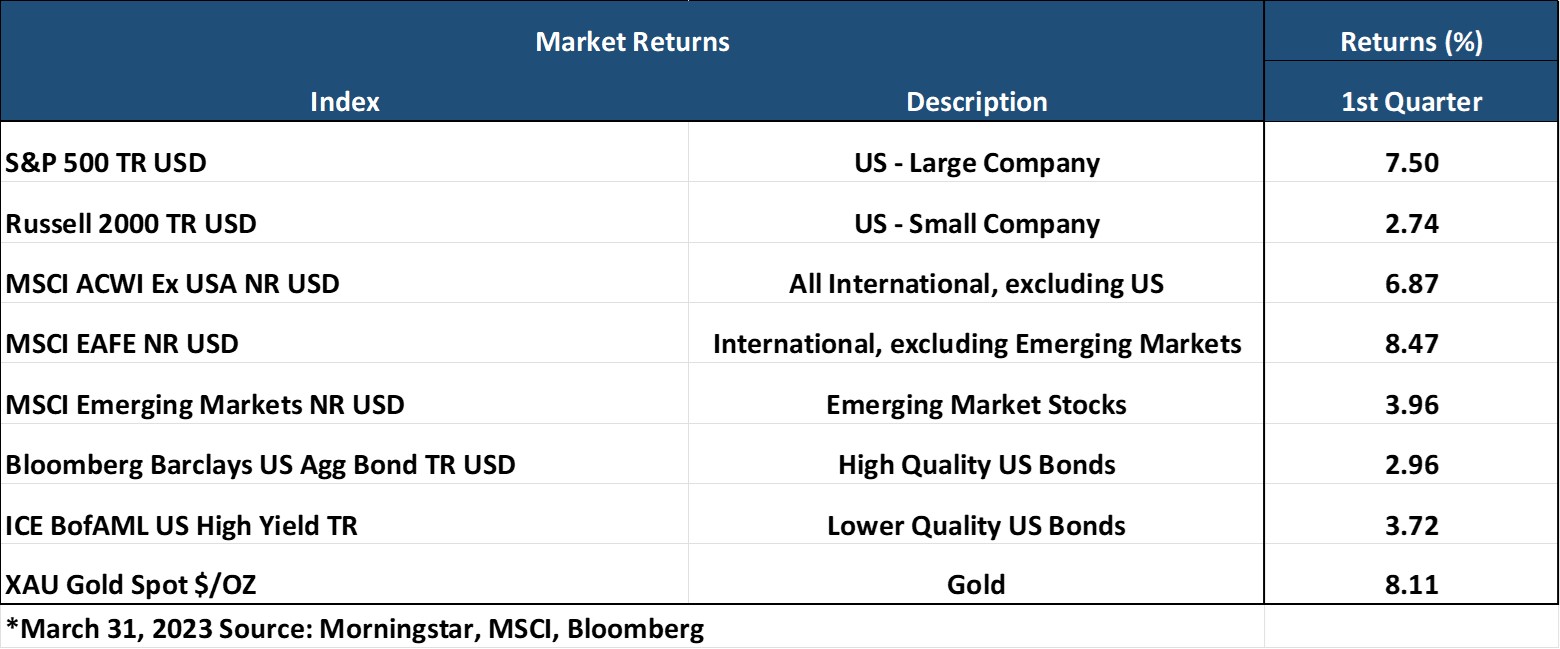
The first quarter of 2023 continued the stock and bond markets' momentum from the 4th quarter of 2022. U.S. Large cap stocks rallied (S&P500 +7.5%) despite a roller coaster three-month ride. In addition, developed international stocks had another strong quarter (MSCI EAFE +8.5%), as the U.S. dollar declined by 2% against a basket of foreign currencies, a tailwind for overseas securities. Bonds also delivered a solid positive return (AGG +3%) as interest rates generally declined as signs of potential stress emerged within the banking sector, leading to a “flight to quality” into bonds in March.
While inflation has been and will continue to be the primary concern of policymakers and investors, inflation concerns were sidelined in March as fears over the banking sector's health moved to the forefront after the FDIC’s takeover of Silicon Valley Bank and Signature Bank. Fears also spread into Europe, leading to UBS purchasing Credit Suisse in an arranged regulatory takeover. The Federal Reserve and the Treasury Department moved quickly and forcefully to contain the potential fallout and to forestall a more broad-based "run" on regional banks, by backstopping the uninsured depositors at these banks who had deposits above the normal FDIC limits and providing additional funding to other banks to meet the needs of depositors. Despite averting a more severe banking sector contagion for the time being, the Federal Reserve acknowledged this additional risk factor to the economy, raising interest rates by only 0.25% in March. The rate increase was a more modest move than expected just a week or two before the bank issues began – when a 0.50% increase was being priced in.
At the end of the day, there is a fundamental tension between inflation control (which requires higher rates) and economic stability (which requires interest rate steadiness or lower rates). A recession has been long predicted but has yet to come to the forefront. As a result, the Federal Reserve is in a difficult position as it navigates this balancing act which is creating plenty of uncertainty for markets in the near term.
The Big Picture
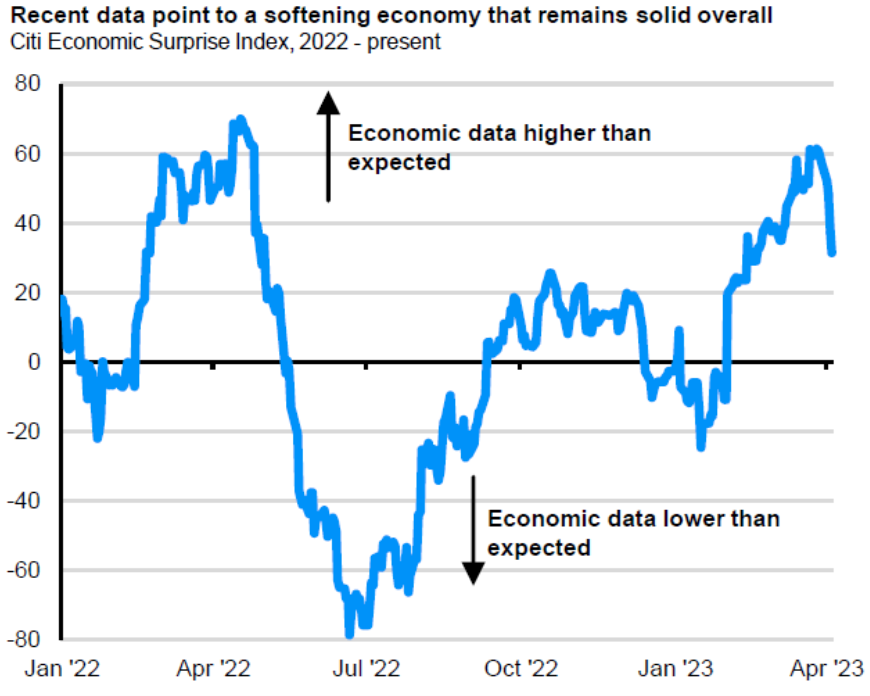
The data continues to paint a mixed picture on the economic front as economic growth remains positive and the labor market remains in good shape. Still, the data has started to soften recently as shown by the Citi Economic Surprise Index, which has witnessed a positive trend of “better than expected” economic data points turn lower in recent weeks (see chart). Additionally, core inflation remains stubbornly high, and corporate earnings are projected to turn lower.
INFLATION: Inflation slowed in March as the Bureau of Labor Statistics announced the Consumer Price Index for All Urban Consumers (CPI-U) increased 0.1% in March on a seasonally adjusted basis, and core inflation rose by 0.4% month over month. The year-over-year rates were 5.0% and 5.6%, respectively, from 6.0% and 5.5% in February. While the headline figure was the lowest increase since May of 2021, the core inflation number increased slightly as shelter costs remain elevated. Overall, inflation remains well above the preferred 2% level of the Fed
GROWTH (Gross Domestic Product): 4Q22 real GDP showed the economy grew by a 2.6% annualized rate, benefiting from a build-up in inventories, which will likely reverse and subtract from GDP in future quarters. Despite two negative quarters of growth to start in 2022, the year finished with a real GDP growth rate of 2.1% (from the 2021 annual level to the 2022 annual level). While the quarterly growth rate in Q4 was positive, the economy is still losing momentum beneath the surface as real consumer spending and residential fixed investment continue downward. As a result, the Atlanta Fed's GDPNow model currently forecasts 1Q23 GDP growth of 2.5% (seasonally adjusted annual rate), down from its peak estimate of 3.5% in March.
JOBS: In March, employers added 236,000 jobs, a sharp drop from the 311,000 gain in February, showing a tight but decelerating labor market. The unemployment rate dropped to 3.5% from 3.6% the previous month. Notably, the jobs reports did show a continued slowdown in the pace of wage growth in March as average hourly earnings increased 4.2% year-over-year from the previous year, down from 4.6% in December. Slower wage growth would ultimately help ease inflationary pressures in the economy.
EARNINGS and ESTIMATES (1st Quarter 2023): The resilience, or lack thereof, of earnings will likely go a long way in determining the path of the stock market in 2023. That is why it is notable that, according to Factset, "Analysts and companies have been more pessimistic in their earnings outlooks for the first quarter compared to historical averages. As a result, estimated earnings for the S&P 500 for the first quarter are lower today compared to expectations at the start of the quarter. The index is now expected to report its largest year-over-year decline in earnings since Q2 2020." The current forecasted year-over-year earnings decline from Factset is -6.8%, and the number of companies that have already issued negative earnings guidance is the most since the third quarter of 2019.
RATES AND THE FED: At its March meeting, the Fed somewhat tempered its previously "hawkish" messaging on monetary policy, hiking rates at a reduced pace of 0.25% to a range of 4.75-5.00%. The Fed acknowledged that the banking sector issues were a risk and that rate increases could be nearing an end. Still, the Federal Reserve Chairman Jerome Powell reiterated that "The process of getting inflation back down to 2% has a long way to go and is likely to be bumpy" and that "rate cuts are not in our base case for 2023." Despite the Fed’s comments, interest rate futures markets are predicting a higher probability that rates will be lower than they are today, rather than higher, by the end of the year.
Market Performance
Global Stocks
For the 1st quarter, all 36 developed markets tracked by MSCI were positive. And for the 40 developing markets tracked by MSCI, 28 of them were positive as well.
- In the U.S., large companies outperformed small ones for the quarter, and growth stocks beat value stocks, given banking sector troubles and movement back into large tech stocks.
- 7 of the 11 S&P 500 sectors delivered positive quarterly returns, with three sectors higher by double-digits.
- The Technology, Communication Services, and Consumer Discretionary sectors performed best for the quarter.
- The Energy, Health Care, Financial, and Utilities sectors posted losses in the first 3-months of 2023.
- Developed international market stocks had a robust quarter, given a decline in the U.S. dollar, leading them to outperform the U.S. market slightly.
- Emerging Market stocks underperformed U.S. stocks and Developed International stocks for the quarter but posted a positive return. The Czech Republic, Greece, Mexico, and Taiwan delivered a strong positive performance for the quarter.
Bonds
The bond market's movement led to positive quarterly returns as interest rates generally declined in the first quarter. As a result, the highlights include the following:
- The 10-year Treasury bond yield decreased by 0.39% for the quarter, sending bond prices higher through March. The yield curve continued to invert further (from 2 years to 10 years), often a harbinger of a recession on the horizon.
- Treasury Inflation-Protected Securities delivered strong positive returns, as investors modestly increased their expectations for future inflation after the inflation data in March.
- Asset-Backed Securities underperformed most other bond market sectors for the quarter, given their lower sensitivity to interest rates.
- Credit spreads, a measure of the bond market's default risk, increased modestly in the investment-grade sector as investors demanded more compensation for assuming credit risk – but declined in the high yield sector. Once again, the highest credit quality bonds provided lower returns than lower credit quality bonds.
- The Municipal market delivered returns on par with the taxable bond market as investors continue to find higher yields attractive on an after-tax basis.
Important Disclosure Information
This report is provided as information and commentary regarding the market. The views expressed in this report are as of the date of the report, and are subject to change based on market and other conditions. This report contains certain statements that may be deemed forward-looking statements. Please note that any such statements are not guarantees of any future performance and actual results or developments may differ materially from those projected.
Please note that nothing in this report post should be construed as an offer to sell or the solicitation of an offer to purchase an interest in any security or separate account. Nothing is intended to be, and you should not consider anything to be, investment, accounting, tax or legal advice. If you would like investment, accounting, tax or legal advice, you should consult with your own financial advisors, accountants, or attorneys regarding your individual circumstances and needs. Advice may only be provided by AtwoB after entering into an investment advisory or financial planning agreement. Moreover, you should not assume that any discussion or information contained in this newsletter serves as the receipt of, or as a substitute for, personalized investment and/or planning advice from AtwoB. If you are an AtwoB client, please remember to contact AtwoB, in writing, if there are any changes in your personal/financial situation or investment objectives for the purpose of reviewing/evaluating/revising our previous recommendations and/or services.
Past performance is not a guarantee of future returns. Investing involves risk and possible loss of principal capital. Different types of investments involve varying degrees of risk, and there can be no assurance that the future performance of any specific investment, investment strategy, or product (including the investments and/or investment strategies recommended or undertaken by AtwoB, or any non-investment related content, made reference to directly or indirectly in this newsletter will be profitable, equal any corresponding indicated historical performance level(s), be suitable for your portfolio or individual situation, or prove successful. Historical performance results for investment indices and/or categories have been provided for general comparison purposes only, and generally do not reflect the deduction of any fees or expenses, transaction and/or custodial charges, the deduction of an investment management fee, nor the impact of taxes, the incurrence of which would have the effect of decreasing historical performance results. It should not be assumed that your account holdings correspond directly to any comparative indices and/or categories.
AtwoB is neither a law firm nor a certified public accounting firm and no portion of the newsletter content should be construed as legal or accounting advice. A copy of the AtwoB's current written disclosure Brochure discussing our advisory services and fees continues to remain available upon request.
Index and Category Definitions
The S&P 500 Index is a capitalization-weighted index of 500 U.S. stocks. Russell 2000 TR USD is a market cap weighted index The Russell 2000 measuring the performance of approximately 2,000 smallest-cap American companies The MSCI All Country World ex-USA Index is a free float-adjusted market capitalization weighted index that is designed to measure the equity market performance of developed and emerging markets. The MSCI All Country World ex-USA Index consists of 22 developed and 24 emerging market country indices. The MSCI EAFE Index (Europe, Australasia, Far East) is a free float-adjusted market capitalization index that is designed to measure the equity market performance of developed markets, excluding the U.S. & Canada. The MSCI Emerging Markets (E.M.) Index is a free float-adjusted market capitalization index that is designed to measure equity market performance of 24 emerging markets countries. Bloomberg Barclays U.S. Aggregate Bond Index ("AGG") is an index of the U.S. investment-grade fixed-rate bond market, including both government and corporate bonds. ICE BofAML U.S. High Yield Index is an unmanaged index of below-investment grade U.S. corporate bonds. XZU Gold Spot $/Oz reflects the exchange rate of Gold against the U.S. dollar index