
Big Picture and Key Takeaway
3rd Quarter 2023
(Click here for Printable PDF)
Key Takeaway
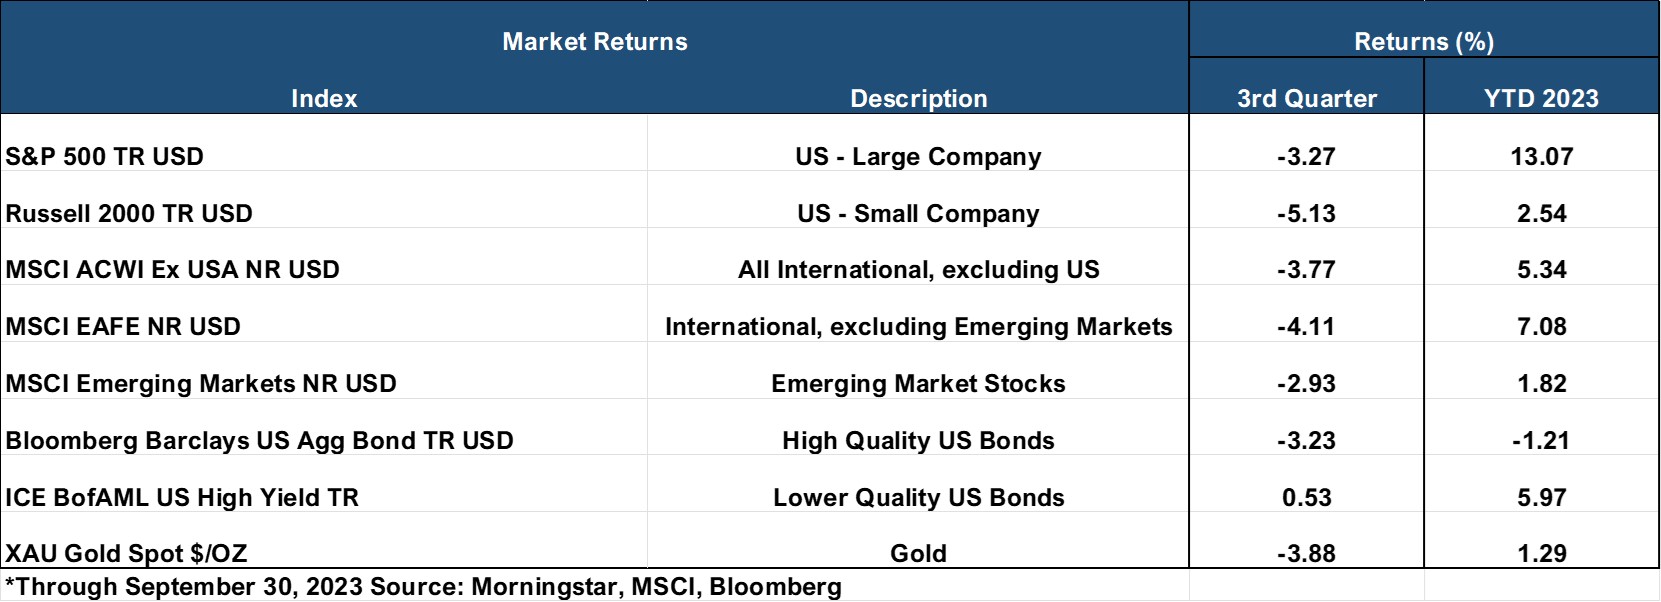
The global stock market rally ran out of steam during the third quarter but remains positive for the year solely on the backs of the red-hot tech and communication sectors, which were beaten down in 2022. During the quarter, U.S. Large cap stocks declined (S&P500 -3.3%) as higher Treasury rates slowed momentum in the equity market, and developed international stocks declined (MSCI EAFE -4.1%) as the U.S. dollar increased sharply. As interest rates rose across the maturity spectrum, the broad-based bond market also languished in the third quarter (AGG -3.2%) and turned slightly negative for the year.
While the Federal Reserve held the short-term Federal Funds Rate steady, at 5.25%-5.50%, at its September policy meeting, Fed Chairman Powell suggested that they were prepared to raise rates one more time this year to combat inflation at either of their two remaining meetings. With full-year 2023 economic growth more robust than anticipated, most Fed officials expect they will need to keep interest rates near their current level through next year. In short, interest rates will likely stay higher for longer than most anyone anticipated coming into the year.
In summary, the Fed will likely need to slow the economy and, particularly, sap the labor market's strength to achieve its stability goals. This reality has led to tightening financial conditions such as higher mortgage rates and borrowing costs. This posture comes at a time when oil prices have moved meaningfully higher, the government continues to flirt with a shutdown, labor strikes hit the auto, entertainment, and healthcare sectors, and student loan payments are set to start again. The markets have been positively pricing in a higher probability of an economic "soft landing," where inflation declines and the economy averts a recession. However, we believe the sharp increase in interest rates, coupled with geo-political tensions, will potentially make the "soft landing" more challenging to achieve and may present significant headwinds for the financial markets going forward.
The Big Picture
The economic data continued to be resilient during the past three months due to a strong job market and wage growth. Consumer spending has also been supported by a significant decline in the personal excess savings accumulated from the government's fiscal stimulus provided to the private sector as a result of the pandemic. With much of that savings depleted (see chart), the tailwind from fiscal policy will likely wane, leaving consumer income growth as the primary pillar of support for the economy.
Change in Personal Excess Savings
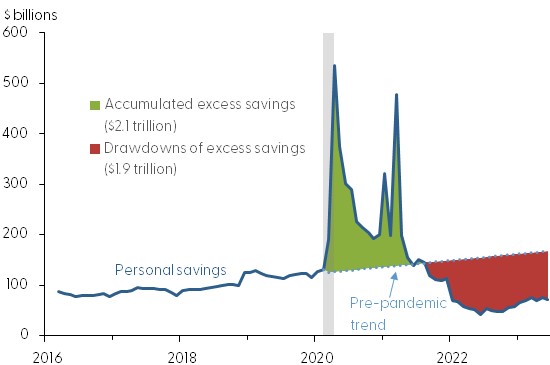
Source: National Bureau of Economic Analysis and San Fransico Fed
INFLATION: In September, the Bureau of Labor Statistics announced the Consumer Price Index for All Urban Consumers (CPI-U) increased 0.4% from August on a seasonally adjusted basis, and Core inflation (all items less food and energy) rose by 0.3% month over month. The year-over-year rates were 3.7% and 4.1%, respectively, from 3.7% and 4.3% in August. Overall, although Core inflation is moving in the right direction, it remains above the preferred 2% level of the Fed. With a tight labor market, the Fed will continue to keep a close eye on wage growth, which has moderated slightly of late as hourly earnings rose only 0.2% in September. Furthermore, workers’ willingness to strike as seen recently in the auto, healthcare, and entertainment sectors may potentially keep wage growth elevated.
GROWTH (Gross Domestic Product): The Bureau of Economic Analysis reported that Real Gross Domestic Product increased at an annual rate of 2.1% in the second quarter of 2023. In the first quarter, real GDP increased 2.2%. Compared to the first quarter, the change in real GDP in the second quarter primarily reflected a slowdown in consumer spending, a downturn in exports, and a deceleration in federal government spending that were partly offset by an upturn in private inventory investment, an acceleration in nonresidential fixed investment, and a smaller decrease in residential investment. The Atlanta Fed's GDPNow model currently forecasts 3Q 2023 GDP growth of 4.9%.
JOBS: The September jobs report was a positive surprise, with 336,000 jobs added during the month, well ahead of the consensus estimate of 160,000. The August data was also revised higher from 187,000 to 227,000. The most significant gains were in the Leisure and Hospitality category, evidence that U.S. consumers are still spending freely and putting additional upward pressure on inflation. The unemployment rate held steady at 3.8% while average hourly earnings eased slightly from 4.3% to 4.2% - a modest silver lining for the Fed, which would like wage growth to decelerate.
EARNINGS and ESTIMATES: As we look ahead to the 3rd quarter earnings season and the rest of the year, according to Factset, 64% of companies have issued negative EPS guidance for the quarter. Year-over-year earnings are expected to decline by -0.3% for the third quarter, which would mark the 4th straight quarter that a decline in earnings would be posted. However, looking further into the 4th quarter, analysts expect earnings to resume a positive trajectory with a growth of 7.9% year-over-year and a strong 12.2% year-over-year projection for the full year 2024. The optimistic predictions seem to indicate a potential economic soft-landing being priced into earnings forecasts, potentially leaving room for market turmoil if the economy doesn’t meet these expectations.
RATES AND THE FED: The Federal Reserve held interest rates steady at its September policy meeting. The Fed had raised its benchmark federal funds rate at their July 2023 meeting to a range between 5.25% and 5.5%, a 22-year high. Fed Chairman Powell suggested that they were prepared to raise rates one more time this year, at either of their two remaining meetings, to combat inflation. With 2023 economic growth more robust than anticipated, most Fed officials expect they will need to keep interest rates near their current level through next year. The median projections showed the federal funds rate being lowered to around 5% by the end of 2024. That will imply two rate cuts next year if the Fed hikes again this year. Further rate cuts may be pushed into 2025.
Market Performance
Global Stocks
For the 3rd quarter, all 36 developed markets tracked by MSCI were negative. And of the 40 developing markets tracked by MSCI, 36 were also negative.
- In the U.S., large companies outperformed small ones for the quarter, and value stocks beat growth stocks. The same handful of stocks that have led the stock market higher for most of the year led the market down since the beginning of August. Apple, Microsoft, and Nvidia were the leading detractors from Aug. 1 through the end of the quarter, followed by Tesla (TSLA) and Meta Platforms (META).
- 9 of the 11 S&P 500 sectors delivered negative returns.
- The Technology, Utilities, and Real Estate sectors performed worst for the quarter, all of which are negatively impacted by higher interest rates.
- The Energy sector was a bright spot as oil prices were by 32% for the quarter.
- Developed international market stocks also posted losses in the third quarter, hampered by a strong rally in the U.S. dollar.
- Emerging Market stocks outperformed U.S. stocks and Developed International stocks for the quarter but have the lowest return for the year-to-date period. India continued its positive performance, while China delivered a modest loss – extending its 2023 losses.
Bonds
The bond market's movement once again led to a negative quarterly return as interest rates increased during the quarter. As a result, the highlights include the following:
- The 10-year Treasury bond yield increased by 0.76% for the quarter, sharply lowering bond prices through September. The yield curve became less inverted (from 2 years to 10 years) as longer-term interest rates increased more than short-term interest rates as the market anticipates higher interest rates for longer.
- Treasury Inflation-Protected Securities delivered negative returns, as real interest rates increased sharply, and investors only modestly increased their expectations for future inflation throughout the quarter.
- Asset-backed securities delivered a modest positive return and outperformed most other bond market sectors for the quarter, given their lower sensitivity to interest rates and resilient cash flows.
- Credit spreads, a measure of the bond market's default risk, remained unchanged for the quarter. Once again, the highest credit quality bonds provided lower returns than lower credit quality bonds – which have a higher income payment due to their inferior credit quality.
- The Municipal market delivered a negative return and underperformed its taxable bond market counterparts as yields on AAA municipal bonds increased more than equivalent maturity Treasury Bonds.
Important Disclosure Information
This report is provided as information and commentary regarding the market. The views expressed in this report are as of the date of the report, and are subject to change based on market and other conditions. This report contains certain statements that may be deemed forward-looking statements. Please note that any such statements are not guarantees of any future performance and actual results or developments may differ materially from those projected.
Please note that nothing in this report post should be construed as an offer to sell or the solicitation of an offer to purchase an interest in any security or separate account. Nothing is intended to be, and you should not consider anything to be, investment, accounting, tax or legal advice. If you would like investment, accounting, tax or legal advice, you should consult with your own financial advisors, accountants, or attorneys regarding your individual circumstances and needs. Advice may only be provided by AtwoB after entering into an investment advisory or financial planning agreement. Moreover, you should not assume that any discussion or information contained in this newsletter serves as the receipt of, or as a substitute for, personalized investment and/or planning advice from AtwoB. If you are an AtwoB client, please remember to contact AtwoB, in writing, if there are any changes in your personal/financial situation or investment objectives for the purpose of reviewing/evaluating/revising our previous recommendations and/or services.
Past performance is not a guarantee of future returns. Investing involves risk and possible loss of principal capital. Different types of investments involve varying degrees of risk, and there can be no assurance that the future performance of any specific investment, investment strategy, or product (including the investments and/or investment strategies recommended or undertaken by AtwoB, or any non-investment related content, made reference to directly or indirectly in this newsletter will be profitable, equal any corresponding indicated historical performance level(s), be suitable for your portfolio or individual situation, or prove successful. Historical performance results for investment indices and/or categories have been provided for general comparison purposes only, and generally do not reflect the deduction of any fees or expenses, transaction and/or custodial charges, the deduction of an investment management fee, nor the impact of taxes, the incurrence of which would have the effect of decreasing historical performance results. It should not be assumed that your account holdings correspond directly to any comparative indices and/or categories.
AtwoB is neither a law firm nor a certified public accounting firm and no portion of the newsletter content should be construed as legal or accounting advice. A copy of the AtwoB's current written disclosure Brochure discussing our advisory services and fees continues to remain available upon request.
Index and Category Definitions
The S&P 500 Index is a capitalization-weighted index of 500 U.S. stocks. Russell 2000 TR USD is a market cap weighted index The Russell 2000 measuring the performance of approximately 2,000 smallest-cap American companies The MSCI All Country World ex-USA Index is a free float-adjusted market capitalization weighted index that is designed to measure the equity market performance of developed and emerging markets. The MSCI All Country World ex-USA Index consists of 22 developed and 24 emerging market country indices. The MSCI EAFE Index (Europe, Australasia, Far East) is a free float-adjusted market capitalization index that is designed to measure the equity market performance of developed markets, excluding the U.S. & Canada. The MSCI Emerging Markets (E.M.) Index is a free float-adjusted market capitalization index that is designed to measure equity market performance of 24 emerging markets countries. Bloomberg Barclays U.S. Aggregate Bond Index ("AGG") is an index of the U.S. investment-grade fixed-rate bond market, including both government and corporate bonds. ICE BofAML U.S. High Yield Index is an unmanaged index of below-investment grade U.S. corporate bonds. XZU Gold Spot $/Oz reflects the exchange rate of Gold against the U.S. dollar index