
Big Picture and Key Takeaway
4th Quarter 2021
Key Takeaway
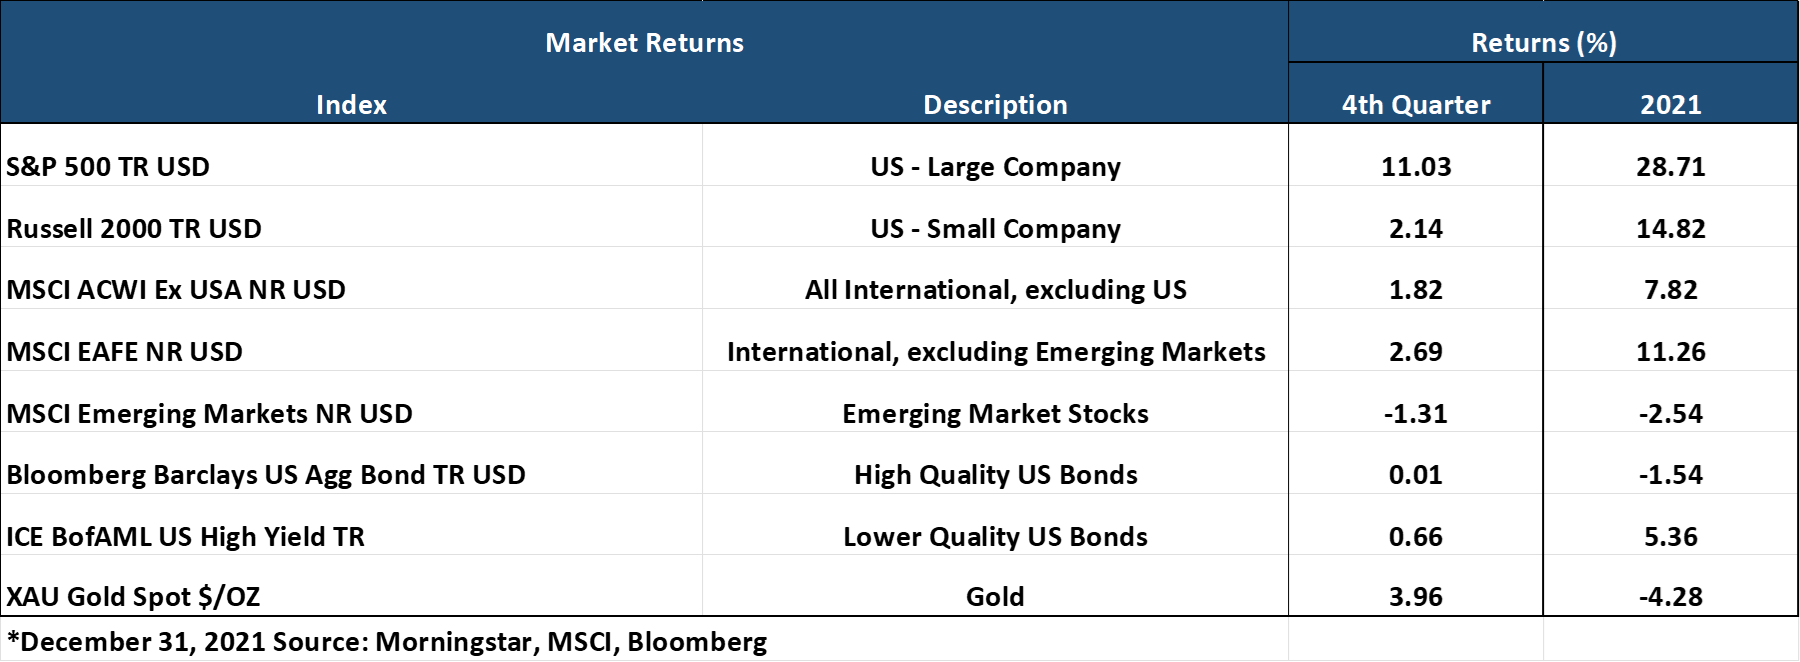
2021 was punctuated by a strong 11% return during the 4th quarter for U.S. stocks, capping another strong year returning 28%. Global stocks, with the exception of emerging markets, faced down headwinds from higher inflation and the emergence of the Omicron variant of COVID in favor of tailwinds from strong corporate earnings growth, a red-hot real estate market and low unemployment. On the negative side of the ledger for 2021, emerging market stocks, gold and high-quality bonds generally declined in 2021, impacted by a stronger U.S. dollar and higher interest rates. Going forward, the global markets will have to contend with a less supportive monetary policy, as the Fed has committed to raising interest rates and ending their bond purchase program, while fiscal stimulus is set to slow down significantly from recent years. Can the economy and markets hold up without the crutch of continual stimulus?
The Big Picture
- In the fourth quarter, global equity markets produced positive results, setting aside inflation and Omicron COVID variant concerns and focusing instead on strong consumer confidence, rising house prices, and better than expected corporate earnings growth. U.S. stocks continued the long trend of outperforming international stocks. During the quarter interest rates dropped a touch resulting flat bond market returns.
- The Department of Labor delivered mixed economic news in its December report. The national unemployment rate fell to 3.9 percent, but job creation slowed down as only 199k jobs were added for the month as compared to a pre-report expectation of 422k jobs created.
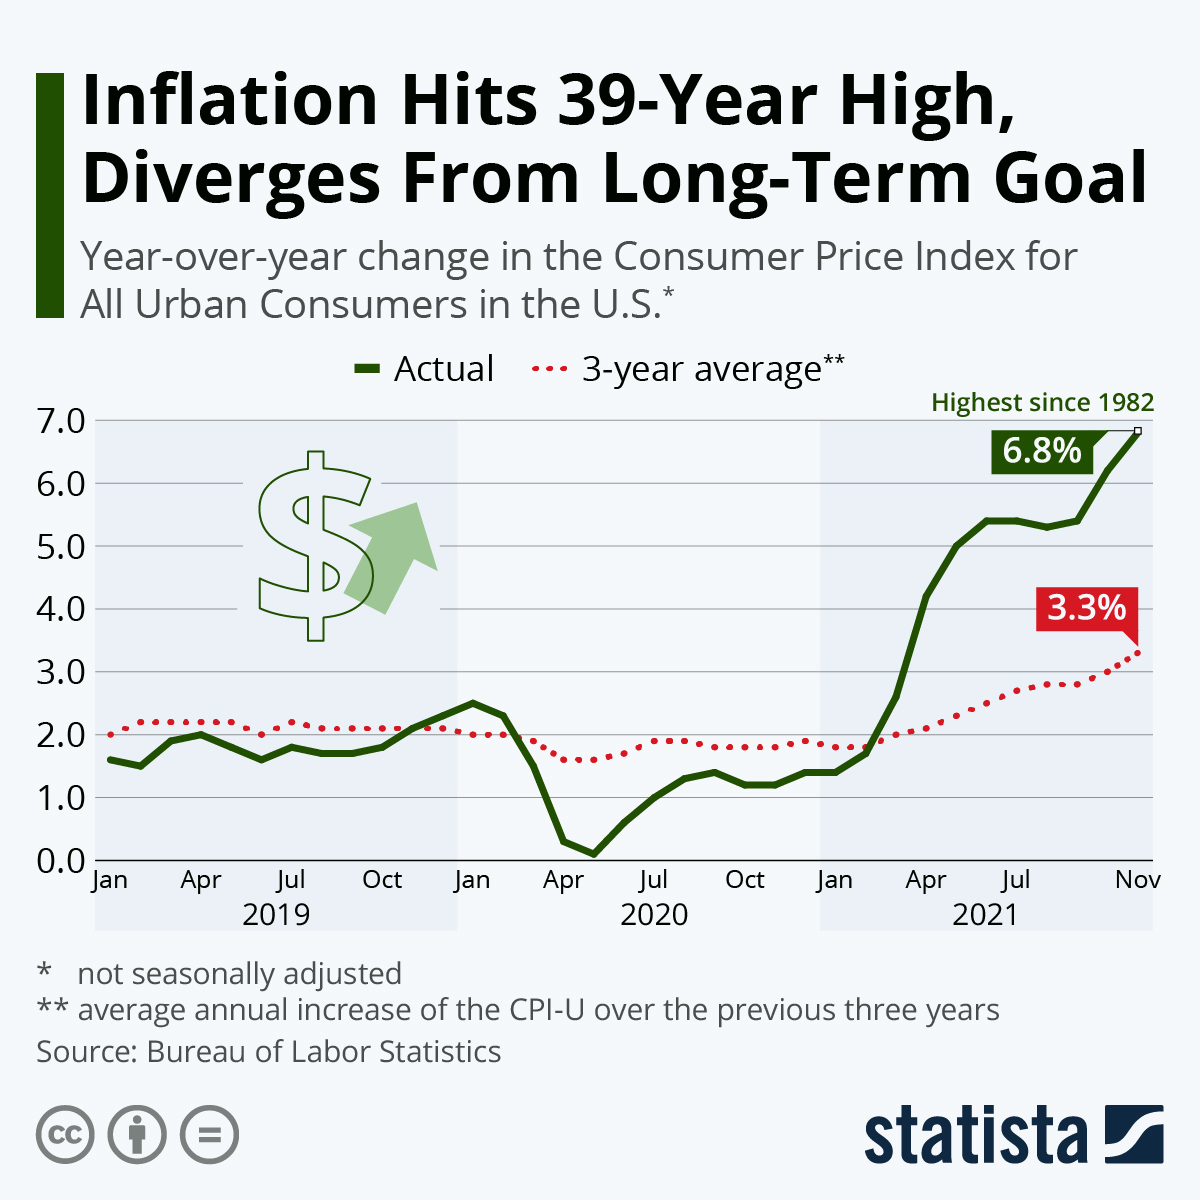
- Inflation and supply chain issues remain a primary focus concern for policymakers and markets. Consumer prices in the United States continued to rise in November, as inflation hit a 39-year high. The Consumer Price Index was up 6.8 percent compared to a year ago, while the core index excluding more volatile food and energy prices surged by 4.9 percent from November 2020 levels. Those were the highest readings since June 1982 and June 1991, respectively.
- As inflation increased throughout the year, the Fed contended that the higher inflation was "transitory." Then in November, Fed Chairman Jerome Powell said, "We tend to use [the word transitory] to mean that it won't leave a permanent mark in the form of higher inflation. I think it's probably a good time to retire that word and try to explain more clearly what we mean." Finally, in December, Powell completed the Fed's "pivot" by saying, "There is a real risk now … that inflation may be more persistent" and that "the risk of inflation becoming more entrenched has increased." The recent release of the Fed's December meeting minutes has led markets to believe that rate hikes will commence in March instead of June to coincide with the end of the Fed's bond-buying program.
- On the fiscal policy front, the prospects for the hotly debated "Build Back Better" bill were dealt a setback as Senator Joe Manchin determined he would not vote for the bill as it was being structured. If there is still a way ahead for the potential $1 trillion to $3.5 trillion bill, it will likely depend on reducing the cost of the proposals by either eliminating proposed programs or shortening their duration.
Market Performance
Global Stocks
For the 4th quarter, 32 of 36 developed markets tracked by MSCI delivered positive returns. In contrast, 27 out of 40 developing markets tracked by MSCI delivered negative returns. The strong finish for the U.S. and developed international markets led to another year of double-digit returns, although the U.S gained 2.5 times more. Additional highlights include:
- In the U.S., large companies doubled the performance of small companies, and growth stocks outperformed value stocks.
- 10 out of 11 S&P 500 sectors delivered positive returns for the 4th quarter, with only the Communications Services sector barely declining.
- Real Estate, Tech, and Materials posted the best returns among sectors for the quarter, all solidly in double-digit territory. In addition, the Energy sector, which struggled mightily in 2020, finished with the best return for the entire year.
- Developed market international stocks handily outperformed emerging markets stocks, which lagged as China's market struggles continued, and Turkey suffered from a problematic currency crisis to end the year.
Bonds
Overall, the bond markets' movement led to flat returns for the quarter as Treasury bond yields moved modestly lower. The quarterly highlights include:
- The 10-year Treasury bond yield decreased 0.02% for the quarter, while the yield curve flattened from the end of the third quarter in anticipation of the Fed raising short-term rates.
- Treasury Inflation-Protected Securities delivered the best returns of any sector and performed much better than regular Treasury bonds on a relative basis, as investors continued to anticipate higher inflation.
- Non-investment-grade bonds (high yield), which have returns that often correlate with stocks, again delivered positive performance for the quarter.
- Credit spreads, a measure of the risk of default in the bond market, once again increased modestly for the quarter as investors demanded slightly more compensation for assuming credit risk.
- Municipal bonds delivered a solid Q4 as investors moved into the sector in anticipation of potentially higher tax rates.
Important Disclosure Information
This report is provided as information and commentary regarding the market. The views expressed in this report are as of the date of the report, and are subject to change based on market and other conditions. This report contains certain statements that may be deemed forward-looking statements. Please note that any such statements are not guarantees of any future performance and actual results or developments may differ materially from those projected.
Please note that nothing in this report post should be construed as an offer to sell or the solicitation of an offer to purchase an interest in any security or separate account. Nothing is intended to be, and you should not consider anything to be, investment, accounting, tax or legal advice. If you would like investment, accounting, tax or legal advice, you should consult with your own financial advisors, accountants, or attorneys regarding your individual circumstances and needs. Advice may only be provided by AtwoB after entering into an investment advisory or financial planning agreement. Moreover, you should not assume that any discussion or information contained in this newsletter serves as the receipt of, or as a substitute for, personalized investment and/or planning advice from AtwoB. If you are an AtwoB client, please remember to contact AtwoB, in writing, if there are any changes in your personal/financial situation or investment objectives for the purpose of reviewing/evaluating/revising our previous recommendations and/or services.
Past performance is not a guarantee of future returns. Investing involves risk and possible loss of principal capital. Different types of investments involve varying degrees of risk, and there can be no assurance that the future performance of any specific investment, investment strategy, or product (including the investments and/or investment strategies recommended or undertaken by AtwoB, or any non-investment related content, made reference to directly or indirectly in this newsletter will be profitable, equal any corresponding indicated historical performance level(s), be suitable for your portfolio or individual situation, or prove successful. Historical performance results for investment indices and/or categories have been provided for general comparison purposes only, and generally do not reflect the deduction of any fees or expenses, transaction and/or custodial charges, the deduction of an investment management fee, nor the impact of taxes, the incurrence of which would have the effect of decreasing historical performance results. It should not be assumed that your account holdings correspond directly to any comparative indices and/or categories.
AtwoB is neither a law firm nor a certified public accounting firm and no portion of the newsletter content should be construed as legal or accounting advice. A copy of the AtwoB's current written disclosure Brochure discussing our advisory services and fees continues to remain available upon request.
Index and Category Definitions
The S&P 500 Index is a capitalization-weighted index of 500 U.S. stocks. Russell 2000 TR USD is a market cap weighted index The Russell 2000 measuring the performance of approximately 2,000 smallest-cap American companies The MSCI All Country World ex-USA Index is a free float-adjusted market capitalization weighted index that is designed to measure the equity market performance of developed and emerging markets. The MSCI All Country World ex-USA Index consists of 22 developed and 24 emerging market country indices. The MSCI EAFE Index (Europe, Australasia, Far East) is a free float-adjusted market capitalization index that is designed to measure the equity market performance of developed markets, excluding the U.S. & Canada. The MSCI Emerging Markets (E.M.) Index is a free float-adjusted market capitalization index that is designed to measure equity market performance of 24 emerging markets countries. Bloomberg Barclays U.S. Aggregate Bond Index is an index of the U.S. investment-grade fixed-rate bond market, including both government and corporate bonds. ICE BofAML U.S. High Yield Index is an unmanaged index of below-investment grade U.S. corporate bonds. XZU Gold Spot $/Oz reflects the exchange rate of Gold against the U.S. dollar index