
Big Picture and Key Takeaway
1st Quarter 2022
Key Takeaway
For diversified investors at every portfolio risk level, there has been nowhere to hide as stocks and bonds have both declined. There are many factors contributing to a difficult start to 2022 for stocks and bonds, starting with multi-decade high inflation and the Federal Reserve’s potential response to it, rising interest rates, high stock valuations, all exacerbated by the negative crosscurrents introduced by the Russian invasion of Ukraine. In the short term, the war likely raises the odds of a global economic slowdown while adding to the inflationary pressures building up in the post-COVID economy. Despite the risks added by the war, the Federal Reserve has signaled its commitment to controlling inflation by raising interest rates, but the Fed is in a difficult position. Their strategy can either let inflation run too hot, or risk tipping the economy into a slowdown.
In the short term, interest rate increases lead to bond price declines. In this case, a very sharp interest rate ascent has led to larger than normal declines over a relatively brief period of time. We believe this is the bond market ripping the band-aid off after an unusually long period of historically low interest rates. However, the increase in rates has led to higher current yields in bonds, which should in turn make future returns on bonds more attractive. The transition towards higher rates and the unknowns around the persistence of inflation will likely make markets more volatile and less fruitful than we’ve grown accustomed. While our return expectations for stocks and bonds are generally modest as compared to history, and much lower than the last 10-years, the recent short-term pain in the bond market is the price being paid for potential long-term gain.
The Big Picture
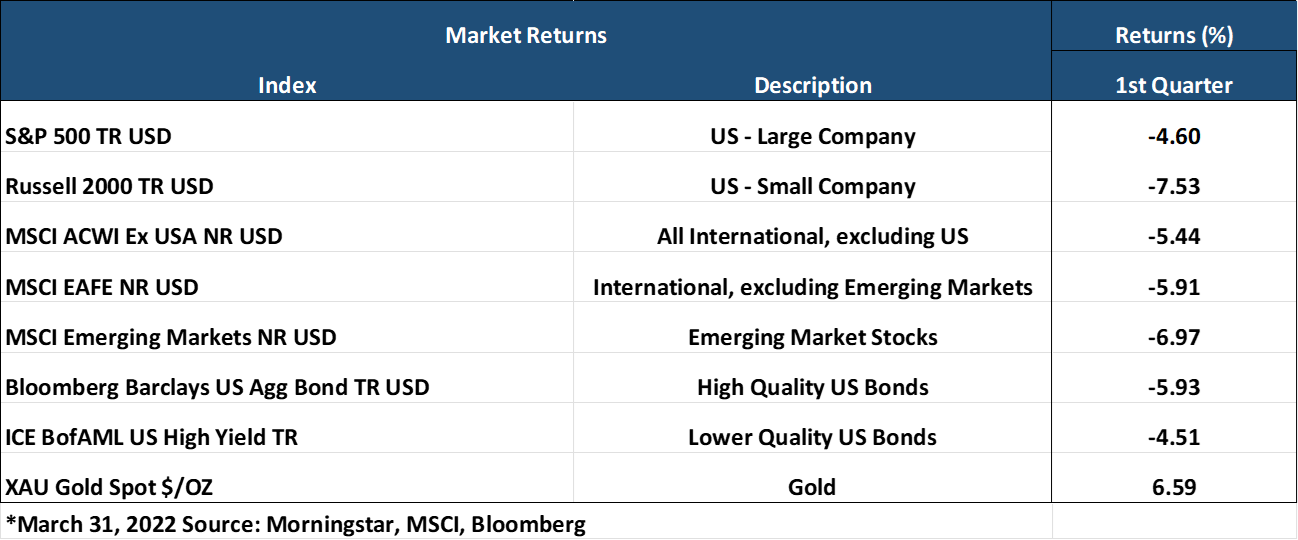
- In the first quarter, Bonds, U.S. Large and Small Company Stocks, and International Developed and Emerging Market Stocks were all down around the same amount between 5-7%. The bond market, measured by the Bloomberg Aggregate US Bond Index, had its worst quarter in over 20 years. It's particularly rare for bonds to be performing as poorly as stocks - when stocks are down. With both stocks and bonds losing ground, there have been few ports in the storm for diversified investors outside of cash, commodities, and short-term Inflation-Protected Bonds.
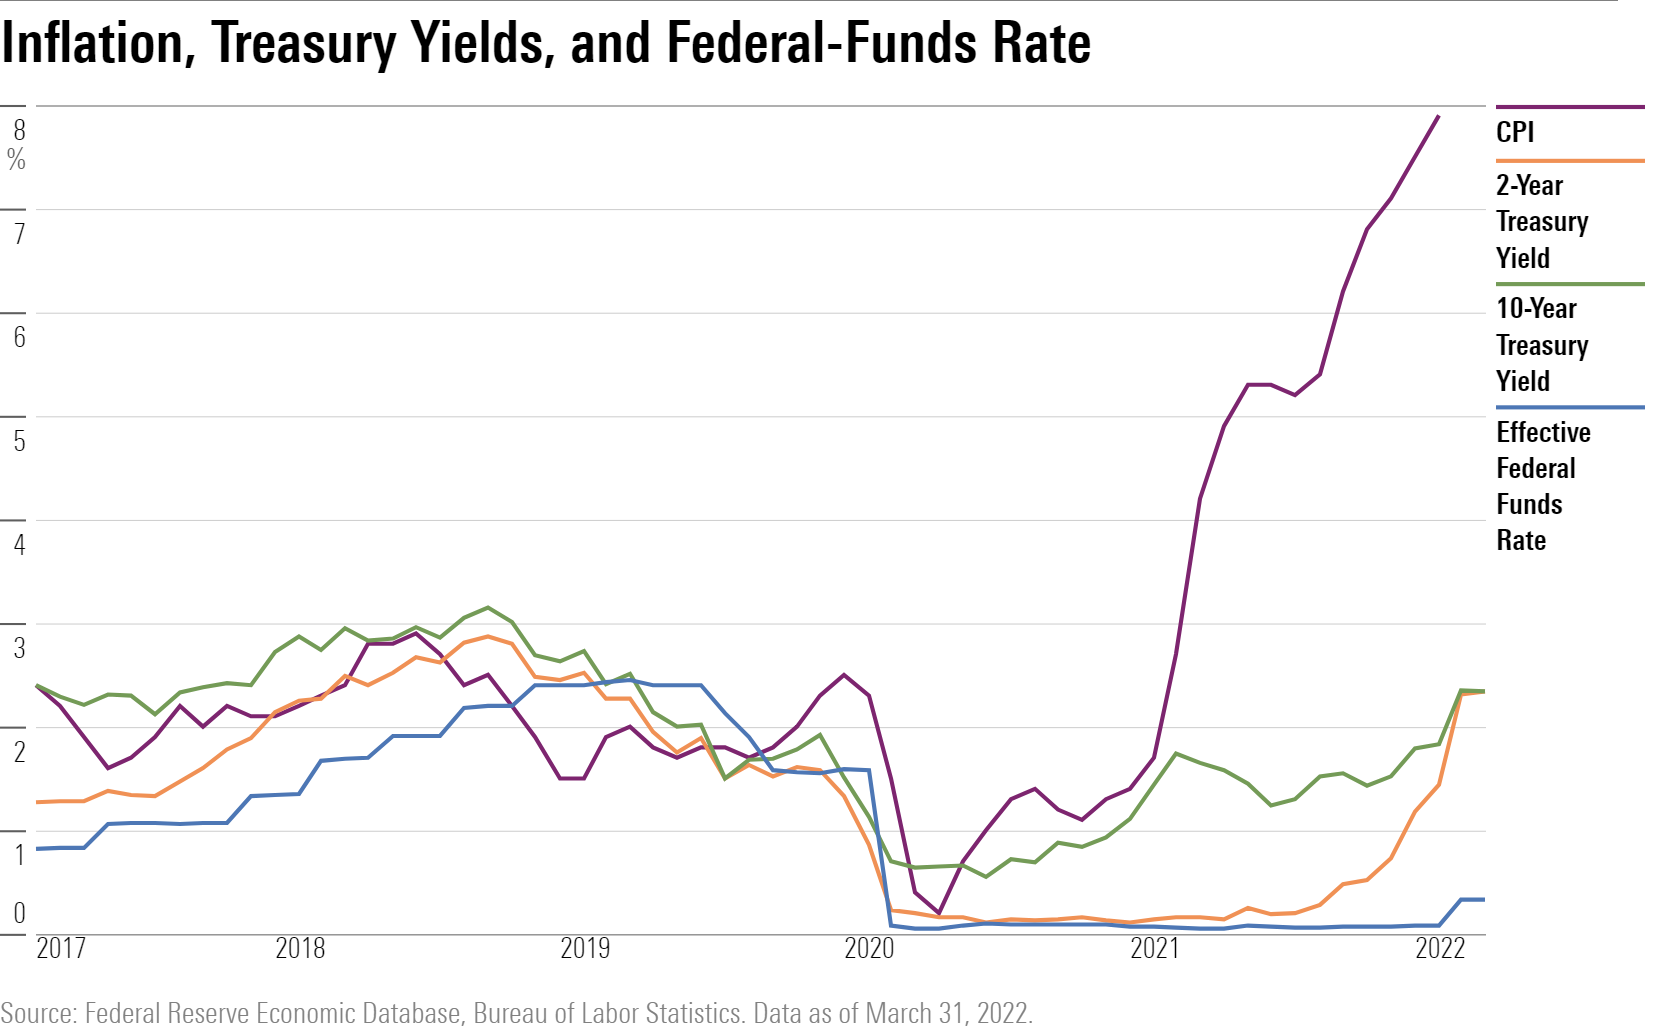
- As measured by the Consumer Price Index (CPI), inflation delivered an 8.5% year-over-year increase in March – the highest level since 1981. Food and Energy prices were meaningful contributors to this growth and will continue to be impactful given that Russian and Ukrainian food and energy exports have been effectively halted. Adding to inflationary pressure is a tight labor market, which allows workers to drive potential wage increases and leads to further higher prices. Unemployment (3.6%) is nearly at record lows. In addition, the number of job openings exceeds the number of unemployed by the widest margin in the past 20 years.
- At the March meeting, the Federal Reserve moved its fed funds target rate from near zero to a range of 0.25% to 0.50%, the first increase since 2018. In general, the Fed downgraded its forecast for economic growth while upwardly revising inflation projections. As it relates to the impact of the war, the Fed said, "The invasion of Ukraine by Russia is causing tremendous human and economic hardship. The implications for the U.S. economy are highly uncertain, but in the near term the invasion and related events are likely to create additional upward pressure on inflation and weigh on economic activity." The Fed's updated policy forecast showed that we could expect rates to increase by 0.25% seven times in 2022.
- The Russian invasion of Ukraine has led to a swift and robust repudiation throughout the western world, strong sanctions that have financially isolated Russia, and has unified much of Europe in ways many did not think were possible. For example, Germany is re-militarizing almost overnight, Switzerland is no longer neutral, and NATO is reinvigorated. More broadly, the post-World War 2 economic order of globalization and free trade seems to be unwinding to a degree, likely making the global economy much less efficient in the years ahead. Moreover, due to the war, the rise in food and energy prices will likely act as a tax on global consumers for some time.
Market Performance
Global Stocks
For the 1st quarter, 35 of 36 developed markets tracked by MSCI delivered negative returns. Additionally, 26 out of 40 developing markets tracked by MSCI had negative returns. Despite the negative quarter, a strong March for the U.S. helped it modestly exceed the returns of the international markets. Additional highlights include:
- In the U.S., large companies exceeded the performance of small companies, and value stocks handily outperformed growth stocks.
- 9 out of 11 S&P 500 sectors delivered negative returns for the 1st quarter, with only the Energy and Utilities sectors producing positive returns.
- The Technology, Communication Services, and Consumer Discretionary sectors were the worst performing sectors for the quarter. On the other hand, the Energy sector (+38%) moved sharply higher on the coattails of a sharp increase in the price of crude oil (+33%) and natural gas (+51%).
- International Developed markets modestly outperformed emerging markets stocks, primarily due to another problematic quarter for China's market. Among developed countries, the commodity-exporting nations of Canada and Australia delivered positive returns.
Bonds
Overall, the bond markets' movement led to negative returns for the quarter as Treasury bond yields moved sharply higher. The quarterly highlights include:
- The 10-year Treasury bond yield increased a whopping 0.82% for the quarter, while the yield curve flattened significantly and nearly inverted (from 2 years to 10-years), which is often a harbinger of a recession on the horizon.
- Treasury Inflation-Protected Securities delivered the best returns of any sector and performed much better than regular Treasury bonds on a relative basis, as investors anticipate higher inflation.
- Asset-Backed Securities delivered the most negligible negative returns outside of TIPS, given their lower sensitivity to interest rates and steady cash flows.
- Credit spreads, a measure of the risk of default in the bond market, increased for the quarter as investors demanded higher compensation for assuming credit risk against a riskier economic backdrop.
- The Municipal market experienced the worst quarterly performance it has seen in recent years, which has moved yields up to levels that haven't been reached since 2019.
Important Disclosure Information
This report is provided as information and commentary regarding the market. The views expressed in this report are as of the date of the report, and are subject to change based on market and other conditions. This report contains certain statements that may be deemed forward-looking statements. Please note that any such statements are not guarantees of any future performance and actual results or developments may differ materially from those projected.
Please note that nothing in this report post should be construed as an offer to sell or the solicitation of an offer to purchase an interest in any security or separate account. Nothing is intended to be, and you should not consider anything to be, investment, accounting, tax or legal advice. If you would like investment, accounting, tax or legal advice, you should consult with your own financial advisors, accountants, or attorneys regarding your individual circumstances and needs. Advice may only be provided by AtwoB after entering into an investment advisory or financial planning agreement. Moreover, you should not assume that any discussion or information contained in this newsletter serves as the receipt of, or as a substitute for, personalized investment and/or planning advice from AtwoB. If you are an AtwoB client, please remember to contact AtwoB, in writing, if there are any changes in your personal/financial situation or investment objectives for the purpose of reviewing/evaluating/revising our previous recommendations and/or services.
Past performance is not a guarantee of future returns. Investing involves risk and possible loss of principal capital. Different types of investments involve varying degrees of risk, and there can be no assurance that the future performance of any specific investment, investment strategy, or product (including the investments and/or investment strategies recommended or undertaken by AtwoB, or any non-investment related content, made reference to directly or indirectly in this newsletter will be profitable, equal any corresponding indicated historical performance level(s), be suitable for your portfolio or individual situation, or prove successful. Historical performance results for investment indices and/or categories have been provided for general comparison purposes only, and generally do not reflect the deduction of any fees or expenses, transaction and/or custodial charges, the deduction of an investment management fee, nor the impact of taxes, the incurrence of which would have the effect of decreasing historical performance results. It should not be assumed that your account holdings correspond directly to any comparative indices and/or categories.
AtwoB is neither a law firm nor a certified public accounting firm and no portion of the newsletter content should be construed as legal or accounting advice. A copy of the AtwoB's current written disclosure Brochure discussing our advisory services and fees continues to remain available upon request.
Index and Category Definitions
The S&P 500 Index is a capitalization-weighted index of 500 U.S. stocks. Russell 2000 TR USD is a market cap weighted index The Russell 2000 measuring the performance of approximately 2,000 smallest-cap American companies The MSCI All Country World ex-USA Index is a free float-adjusted market capitalization weighted index that is designed to measure the equity market performance of developed and emerging markets. The MSCI All Country World ex-USA Index consists of 22 developed and 24 emerging market country indices. The MSCI EAFE Index (Europe, Australasia, Far East) is a free float-adjusted market capitalization index that is designed to measure the equity market performance of developed markets, excluding the U.S. & Canada. The MSCI Emerging Markets (E.M.) Index is a free float-adjusted market capitalization index that is designed to measure equity market performance of 24 emerging markets countries. Bloomberg Barclays U.S. Aggregate Bond Index is an index of the U.S. investment-grade fixed-rate bond market, including both government and corporate bonds. ICE BofAML U.S. High Yield Index is an unmanaged index of below-investment grade U.S. corporate bonds. XZU Gold Spot $/Oz reflects the exchange rate of Gold against the U.S. dollar index