
Big Picture and Key Takeaway
2nd Quarter 2022
Key Takeaway
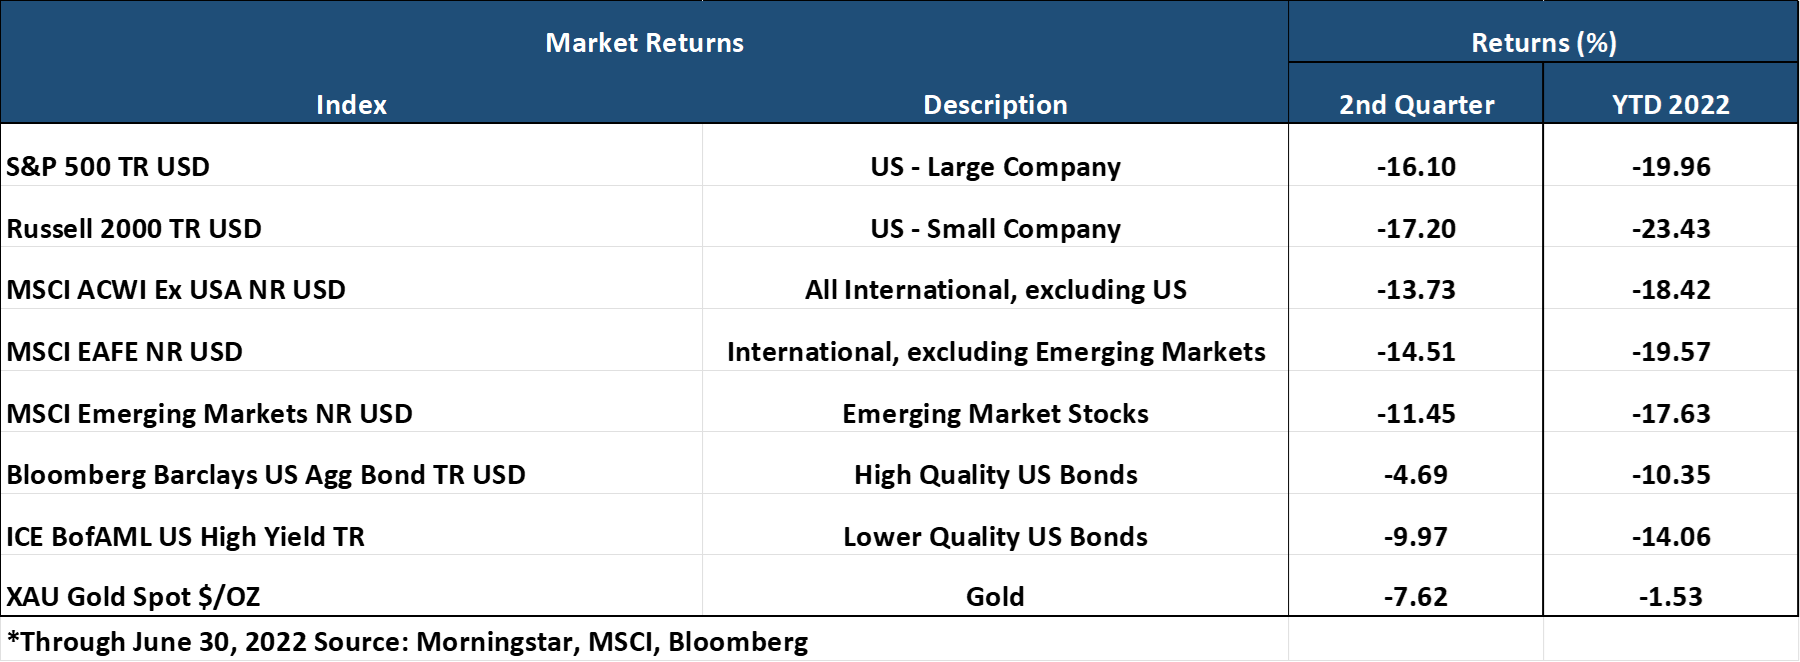
2022 has been a decidedly tumultuous year with several negative market impacts occurring simultaneously. The S&P 500 index experienced its worst 6-months to begin a year since 1970, down by 20%. The bond market, as measured by the Bloomberg Aggregate US Total Return Index, experienced the largest loss since its inception in the 1970’s, down by approximately 10%. In short, this is the worst first half of a year for stocks and bonds in 50 years or so, exacerbated by the fact that both asset classes are feeling the pain at the same time, which is rare.
Both asset classes have been driven down by high inflation and the accompanying steep increase in interest rates to combat rising prices. Inflation increased by 9.1% year-over-year in June, its largest jump since 1981. In response, the Federal Reserve, increased the Fed Funds rate by 0.75% in June, the largest increase in nearly 30 years, and is expected to do the same in July.
The Fed has strongly signaled its commitment to bringing inflation down, all while the economy is exhibiting signs of slowing down as housing cools, manufacturing activity slows and consumer confidence hits new lows. The Fed remains in a difficult position, risking a recession to bring inflation down, but ultimately may view the former as the lesser of two evils. For investors, the question is whether a potential recession has been priced into the markets already, or whether more downside is needed to compensate for the risk of potentially lower earnings growth in the event of a slowdown, or an extended recession. Given the recent decline in prices and market valuations, the good news is that our return expectations for stocks and bonds have increased over the long-term. However, we suspect that there will be more volatility in the short-term as the markets continuously handicap a number divergent and difficult possible economic outcomes.
The Big Picture
- In the second quarter, U.S. Large and Small Company Stocks and International Developed and Emerging Market Stocks were all down by double-digits, adding to the declines in the first quarter. In addition, the bond market, measured by the Bloomberg Aggregate US Bond Index, followed its worst quarter in over 20 years with another significant decline.
- On the economic front, the question confronting investors is whether inflation can come back down to earth without declining consumer demand and economic growth. Unfortunately, the data so far on both fronts has not been comforting:
- On July 13th, the U.S. Bureau of Labor Statistics reported that the Consumer Price Index for All Urban Consumers (CPI) increased 1.3% in June after rising 1% in May. Over the past 12 months, the Consumer Price Index increased 9.1%. CPI readings are expected to remain high in months to come, as the impact of high energy and shelter costs are expected to keep readings elevated.
- In contrast, economic growth seems to be languishing. As the quarter wound down, the Bureau of Economic Analysis released its 3rd estimate of 1st quarter GDP and reported that real GDP decreased at an annual rate of 1.6%. Moreover, according to the Atlanta Fed's GDPNow estimate on July 7th, 2nd quarter GDP growth is expected to decline by 1.9%. If the actual GDP number remains in negative territory, it would indicate that the U.S. may already be in a technical definition of a recession.
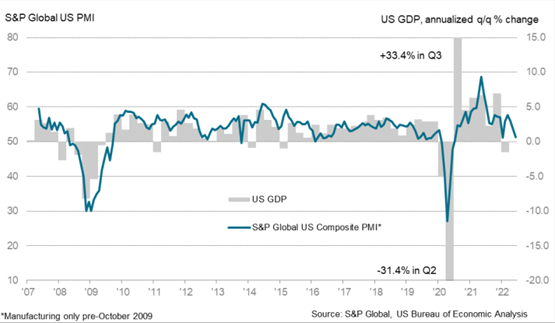
- Further deterioration of GDP estimates are evident as readings from S&P Global US PMI on manufacturing have cooled, which can often precede or coincide with a recession as the measure turns negative (see chart). In addition, existing-home sales have fallen to pre-pandemic levels, and the University of Michigan's Consumer Sentiment Index for June was the lowest reading on record.
- Oddly, if the economy is currently in a recession, it would be doing so with unemployment at incredibly low levels. The June employment report indicated another strong month of job growth, with the economy adding another 372k jobs. Moreover, the unemployment rate at 3.6% is near the half-century low reached before the pandemic.
- At the June meeting, the Federal Reserve increased the Fed Funds rate by an amount not seen in almost 30 years. On the heels of a 0.50% increase in May, the Fed increased the Federal Funds rate by 0.75%, thereby raising the target range to 1.50-1.75%. According to the midpoint target range of the individual Fed members, the Fed Funds rate is expected to end the year at 3.4%, suggesting several additional and significant increases will be required to bring inflation down to their target of 2%. In an attempt to alleviate any ambiguity about their intentions, the Fed's statement said, "The Committee is highly attentive to inflation risks" and "The Committee is strongly committed to returning inflation to its 2 percent objective."
Market Performance
Global Stocks
For the 2nd quarter, all 36 developed markets tracked by MSCI delivered negative returns. Additionally, 39 out of 40 developing markets tracked by MSCI had negative returns. However, the international markets, led by the emerging markets, outperformed the U.S. for the quarter. Additional highlights include:
- In the U.S., large companies exceeded the performance of small companies, and value stocks handily outperformed growth stocks once again.
- All 11 S&P 500 sectors delivered negative returns for the quarter, with the more defensive Consumer Staples, Utilities, and Health Care sectors experiencing the least negative impact, along with Energy stocks.
- The Technology, Communication Services, and Consumer Discretionary sectors were the worst performing sectors for the quarter, in a continuation of the performance trend away from growth stocks in the 1st quarter.
- Emerging Market stocks outperformed developed international market stocks due to strong relative performance from the Chinese markets.
Bonds
The bond markets' movement led to negative quarterly returns as Treasury bond yields continued their rapid rise during the quarter. The quarterly highlights include:
- The 10-year Treasury bond yield increased another 0.66% for the quarter, up nearly 1.5% year-to-date, sending bond prices much lower. The yield curve continued to flatten significantly and almost inverted (from 2 years to 10 years), often a harbinger of a recession on the horizon.
- Treasury Inflation-Protected Securities delivered sharply lower returns after a decent start to the year, as investors reduced their expectations for future inflation as economic growth concerns have emerged.
- Asset-Backed Securities continued to outperform other bond market sectors and delivered the most negligible negative returns, given their lower sensitivity to interest rates and steady cash flows.
- Credit spreads, a measure of the risk of default in the bond market, increased significantly as investors demanded higher compensation for assuming credit risk against a riskier economic backdrop. The spread widening particularly impacted high yield bonds, which experienced sharp losses.
- The Municipal market delivered a modest negative return for the quarter, outperforming most other investment-grade sectors after a very difficult first 3-months of the year.
Important Disclosure Information
This report is provided as information and commentary regarding the market. The views expressed in this report are as of the date of the report, and are subject to change based on market and other conditions. This report contains certain statements that may be deemed forward-looking statements. Please note that any such statements are not guarantees of any future performance and actual results or developments may differ materially from those projected.
Please note that nothing in this report post should be construed as an offer to sell or the solicitation of an offer to purchase an interest in any security or separate account. Nothing is intended to be, and you should not consider anything to be, investment, accounting, tax or legal advice. If you would like investment, accounting, tax or legal advice, you should consult with your own financial advisors, accountants, or attorneys regarding your individual circumstances and needs. Advice may only be provided by AtwoB after entering into an investment advisory or financial planning agreement. Moreover, you should not assume that any discussion or information contained in this newsletter serves as the receipt of, or as a substitute for, personalized investment and/or planning advice from AtwoB. If you are an AtwoB client, please remember to contact AtwoB, in writing, if there are any changes in your personal/financial situation or investment objectives for the purpose of reviewing/evaluating/revising our previous recommendations and/or services.
Past performance is not a guarantee of future returns. Investing involves risk and possible loss of principal capital. Different types of investments involve varying degrees of risk, and there can be no assurance that the future performance of any specific investment, investment strategy, or product (including the investments and/or investment strategies recommended or undertaken by AtwoB, or any non-investment related content, made reference to directly or indirectly in this newsletter will be profitable, equal any corresponding indicated historical performance level(s), be suitable for your portfolio or individual situation, or prove successful. Historical performance results for investment indices and/or categories have been provided for general comparison purposes only, and generally do not reflect the deduction of any fees or expenses, transaction and/or custodial charges, the deduction of an investment management fee, nor the impact of taxes, the incurrence of which would have the effect of decreasing historical performance results. It should not be assumed that your account holdings correspond directly to any comparative indices and/or categories.
AtwoB is neither a law firm nor a certified public accounting firm and no portion of the newsletter content should be construed as legal or accounting advice. A copy of the AtwoB's current written disclosure Brochure discussing our advisory services and fees continues to remain available upon request.
Index and Category Definitions
The S&P 500 Index is a capitalization-weighted index of 500 U.S. stocks. Russell 2000 TR USD is a market cap weighted index The Russell 2000 measuring the performance of approximately 2,000 smallest-cap American companies The MSCI All Country World ex-USA Index is a free float-adjusted market capitalization weighted index that is designed to measure the equity market performance of developed and emerging markets. The MSCI All Country World ex-USA Index consists of 22 developed and 24 emerging market country indices. The MSCI EAFE Index (Europe, Australasia, Far East) is a free float-adjusted market capitalization index that is designed to measure the equity market performance of developed markets, excluding the U.S. & Canada. The MSCI Emerging Markets (E.M.) Index is a free float-adjusted market capitalization index that is designed to measure equity market performance of 24 emerging markets countries. Bloomberg Barclays U.S. Aggregate Bond Index is an index of the U.S. investment-grade fixed-rate bond market, including both government and corporate bonds. ICE BofAML U.S. High Yield Index is an unmanaged index of below-investment grade U.S. corporate bonds. XZU Gold Spot $/Oz reflects the exchange rate of Gold against the U.S. dollar index