
Big Picture and Key Takeaway
3rd Quarter 2022
Key Takeaway
There is no shortage of superlatives to describe the first 9-months of 2022. Unfortunately, most of them are quite negative from the perspective of a diversified investor.
- The global stock market, as defined by the MSCI All Country World Index, finished down by approximately 25% for the year-to-date period, placing it squarely in “bear market” territory.
- The U.S. bond market, as defined by the Bloomberg Barclays US Aggregate Index, has declined by nearly 15% for the year-to-date period - the largest decline since the inception of the index in 1976.
- The combination of stock and bond market declines at the same time is quite rare. Since 1976, on a calendar year measurement basis, there has never been a year where both US stock and US bonds were down at the same time. 2022 seems likely to be an exception to that statistic.
In an effort to contain prices and combat high inflation, the Federal Reserve’s aggressive tightening campaign has resulted in a dramatic increase in interest rates this year, leading to a decline in stocks, bonds, and many other investments simultaneously. For context, the Federal Reserve has raised interest rates 5 times totaling 3-3.25% so far in 2022. With the Fed projections forecasting further interest rate hikes, the likelihood of an economic recession and a slowdown in corporate earnings has increased significantly. In short, there has been nowhere to hide in 2022.
Given the double-digit declines for stock and bonds, all portfolio combinations of stock and bonds are down significantly, with no regard to whether an investor invests conservatively (more bonds) or aggressively (more stocks). But we believe there are silver linings hiding within the negativity of the current moment, where it has been hard to find much to be optimistic about.
First, we don't believe that stocks and bonds will likely continue to behave in a way that makes them highly correlated. Notably, over all rolling, monthly 1-year periods since 1976 stocks and bonds have both been negative at the same time only 0.4% of the time. However, the simultaneous negative performance of stocks and bonds has never persisted over 3 and 5-year rolling periods going back to 1976.
Second, as time passes, we believe that bonds will resume their role as a stabilizing investment. In fact, given the sharp increase in bond yields, expected future returns on bonds look more attractive than they have in some time.
Lastly, stocks tend to have robust returns after periods of market decline. We would not expect this time to be different, but the question remains on how long it will take to recover from this downturn in the stock markets. Historically, bear market recoveries take 2-5 years, with the exception of the 2020 Covid-Bear market, which recovered in four months.
The Big Picture
On the economic front, the same questions remain at the forefront of investors' minds - when will inflation start to recede, and will it drag economic growth down along with it? The data continues to be somewhat discouraging for investors:
INFLATION:
- On Thursday, October 13th, the U.S. Bureau of Labor Statistics reported that the Consumer Price Index for All Urban Consumers rose 0.4% in September on a seasonally adjusted basis after being up 0.1% in August. However, the 12-month inflation number stood stubbornly high at 8.2%. And maybe more troubling was that Core inflation (excluding food and energy) jumped to 6.6%, the biggest increase since 1982.
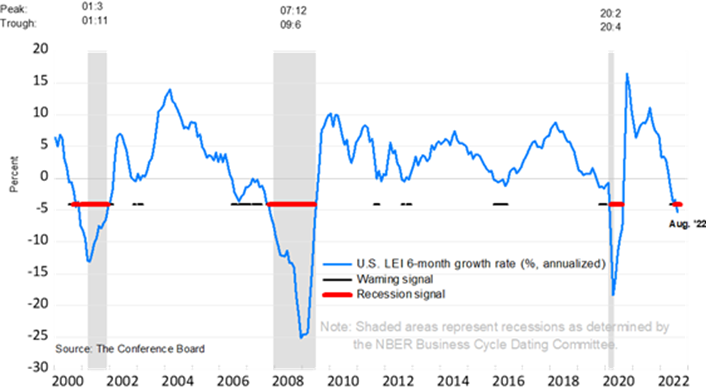
LEADING INDICATOR (WHAT’S NEXT):
- The Conference Board Leading Economic Index for the U.S. decreased by 0.3% in August 2022 after declining by 0.5% in July. As the chart below indicates, it tends to be a reliable recession signal when the 6-month change in the indicator falls as it has. The Conference Board's release delivered a grim economic forecast: "The US LEI declined for a sixth consecutive month potentially signaling a recession. Among the index's components, only initial unemployment claims and the yield spread contributed positively over the last six months—and the contribution of the yield spread has narrowed recently. Furthermore, labor market strength is expected to continue moderating in the months ahead. Indeed, the average workweek in manufacturing contracted in four of the last six months—a notable sign, as firms reduce hours before reducing their workforce. Economic activity will continue slowing more broadly throughout the U.S. economy and is likely to contract. A major driver of this slowdown has been the Federal Reserve's rapid tightening of monetary policy to counter inflationary pressures. The Conference Board projects a recession in the coming quarters."
LAGGING INDICATOR - GDP:
- The Bureau of Economic Analysis released its third estimate of 2nd quarter GDP and announced that it decreased at an annual rate of 0.6%, following a decrease of 1.6% in the first quarter. While two consecutive quarters of GDP decline are the definition of a recession, the official determination remains in limbo due to other factors like a strong labor market. On a somewhat positive note, the Atlanta Fed's GDPNow forecast for the third quarter is +2.7%, but if the leading indicators are to be believed, this may be a temporary boost to growth.
JOBS:
- Once again, the job market continues to be somewhat of an anomaly if the economy is facing a slowdown. The September employment report indicated another month of above-forecast job growth, with the economy adding another 263k jobs. Moreover, the unemployment rate at 3.5% is at a 50-year low. A tight labor market can often lead to higher wages, thereby increasing the likelihood of higher inflation.
THE FED:
- Lastly, all eyes were on the Federal Reserve again in September, and they continued to deliver a harsh message to market participants. The Fed raised the target range for the fed funds rate by 75 basis points up to 3.00-3.25%. Fed Chair Powell struck a very hawkish note when he said that he expects the Fed will get to north of 4% relatively quickly and that the moves by the Fed are likely to cause economic pain. The previously mentioned jobs report is also an example of where good news might be bad news for markets, as the robust number almost ensures that the Fed will remain on its "hawkish" tightening trajectory.
Market Performance
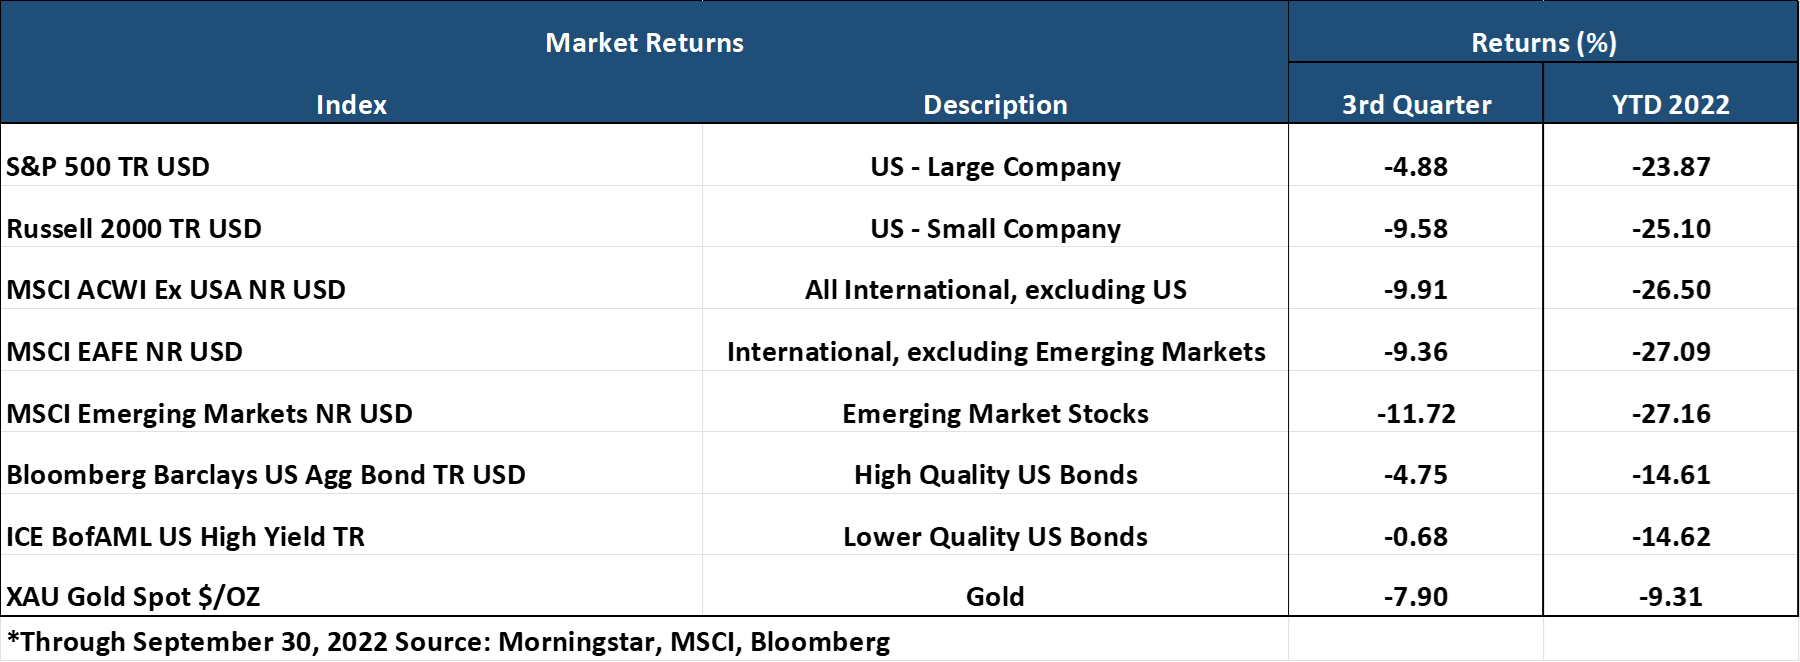
Global Stocks
For the 3rd quarter, all 36 developed markets tracked by MSCI were negative – with most recording negative returns in the double digits. And for the 40 developing markets tracked by MSCI, 38 of them were negative as well.
- In the U.S., large companies declined less than small companies for both the quarter and YTD, and growth stocks outperformed value stocks for the quarter. Still, growth has declined significantly more YTD as investors balanced their concerns of high inflation with potential slower economic growth.
- 10 of the 11 S&P 500 sectors delivered negative returns for the quarter, with only Consumer discretionary stocks delivering a positive 3-month return.
- The Real Estate, Communication Services, and Materials sectors were the worst-performing sectors for the quarter, while energy continues to be one of the few sectors with gains.
- Emerging Market stocks modestly underperformed developed international market stocks, with international stocks more broadly underperforming the U.S. market, given a very strong U.S. dollar. India, Turkey, and Brazil delivered a positive performance for the quarter, while China was deeply negative.
Bonds
The bond markets' movement led to negative quarterly returns as Treasury bond yields continued their rapid rise during the quarter and year. The quarterly highlights include the following:
- The 10-year Treasury bond yield increased another 0.85% for the quarter, up a staggering 2.4% year-to-date, sending bond prices sharply lower. The yield curve continued to flatten significantly and inverted (from 2 years to 10 years), often a harbinger of a recession on the horizon.
- Treasury Inflation-Protected Securities delivered sharply lower returns as investors reduced their expectations for future inflation as economic growth concerns emerged.
- Asset-Backed Securities outperformed other bond market sectors and delivered the most negligible negative returns, given their lower sensitivity to interest rates and steady cash flows.
- Credit spreads, a measure of the risk of default in the bond market, increased significantly as investors demanded higher compensation for assuming credit risk against a riskier economic backdrop. Interestingly, the highest credit quality bonds performed the worst, given their generally higher sensitivity to interest rates.
- The Municipal market delivered a modest negative return for the quarter, outperforming most other investment-grade sectors once again.
Important Disclosure Information
This report is provided as information and commentary regarding the market. The views expressed in this report are as of the date of the report, and are subject to change based on market and other conditions. This report contains certain statements that may be deemed forward-looking statements. Please note that any such statements are not guarantees of any future performance and actual results or developments may differ materially from those projected.
Please note that nothing in this report post should be construed as an offer to sell or the solicitation of an offer to purchase an interest in any security or separate account. Nothing is intended to be, and you should not consider anything to be, investment, accounting, tax or legal advice. If you would like investment, accounting, tax or legal advice, you should consult with your own financial advisors, accountants, or attorneys regarding your individual circumstances and needs. Advice may only be provided by AtwoB after entering into an investment advisory or financial planning agreement. Moreover, you should not assume that any discussion or information contained in this newsletter serves as the receipt of, or as a substitute for, personalized investment and/or planning advice from AtwoB. If you are an AtwoB client, please remember to contact AtwoB, in writing, if there are any changes in your personal/financial situation or investment objectives for the purpose of reviewing/evaluating/revising our previous recommendations and/or services.
Past performance is not a guarantee of future returns. Investing involves risk and possible loss of principal capital. Different types of investments involve varying degrees of risk, and there can be no assurance that the future performance of any specific investment, investment strategy, or product (including the investments and/or investment strategies recommended or undertaken by AtwoB, or any non-investment related content, made reference to directly or indirectly in this newsletter will be profitable, equal any corresponding indicated historical performance level(s), be suitable for your portfolio or individual situation, or prove successful. Historical performance results for investment indices and/or categories have been provided for general comparison purposes only, and generally do not reflect the deduction of any fees or expenses, transaction and/or custodial charges, the deduction of an investment management fee, nor the impact of taxes, the incurrence of which would have the effect of decreasing historical performance results. It should not be assumed that your account holdings correspond directly to any comparative indices and/or categories.
AtwoB is neither a law firm nor a certified public accounting firm and no portion of the newsletter content should be construed as legal or accounting advice. A copy of the AtwoB's current written disclosure Brochure discussing our advisory services and fees continues to remain available upon request.
Index and Category Definitions
The S&P 500 Index is a capitalization-weighted index of 500 U.S. stocks. Russell 2000 TR USD is a market cap weighted index The Russell 2000 measuring the performance of approximately 2,000 smallest-cap American companies The MSCI All Country World ex-USA Index is a free float-adjusted market capitalization weighted index that is designed to measure the equity market performance of developed and emerging markets. The MSCI All Country World ex-USA Index consists of 22 developed and 24 emerging market country indices. The MSCI EAFE Index (Europe, Australasia, Far East) is a free float-adjusted market capitalization index that is designed to measure the equity market performance of developed markets, excluding the U.S. & Canada. The MSCI Emerging Markets (E.M.) Index is a free float-adjusted market capitalization index that is designed to measure equity market performance of 24 emerging markets countries. Bloomberg Barclays U.S. Aggregate Bond Index is an index of the U.S. investment-grade fixed-rate bond market, including both government and corporate bonds. ICE BofAML U.S. High Yield Index is an unmanaged index of below-investment grade U.S. corporate bonds. XZU Gold Spot $/Oz reflects the exchange rate of Gold against the U.S. dollar index