
Big Picture and Key Takeaway
4th Quarter 2022
(Click Here for Printable PDF)
Key Takeaway
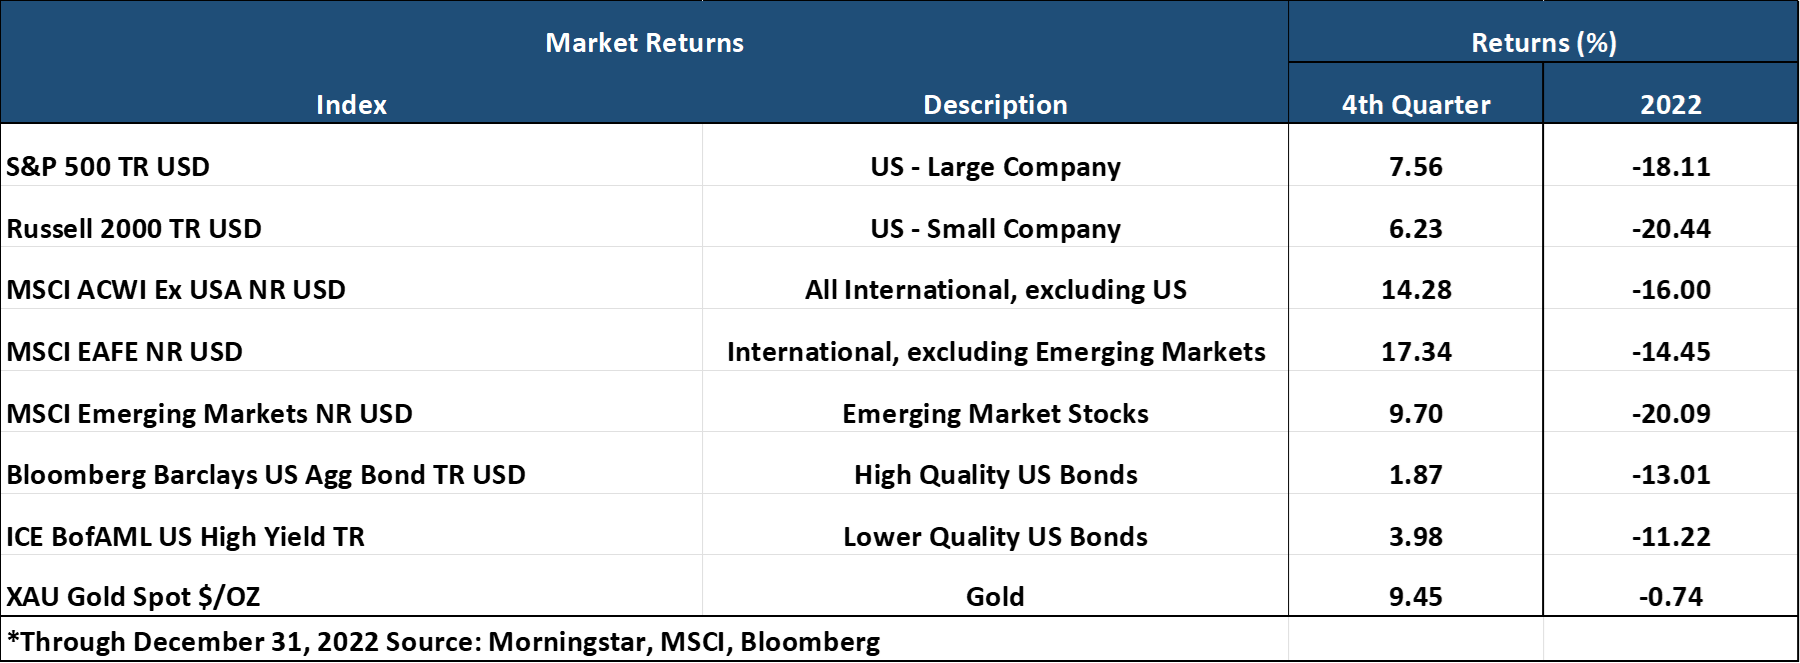
The fourth quarter provided some much-needed relief for investors, cushioning the blow of a challenging year. U.S. Large cap stocks rallied sharply (+7.6% Q4) from mid-October through mid-December, although they lost some steam in the last two weeks of the year. The fade in momentum occurred as the Fed reiterated its commitment to bring down inflation by keeping monetary policy conditions more restrictive for a more extended period than markets expected. In addition, developed international stocks had an excellent quarter (+17.3%), as the U.S. dollar declined by 8% against a basket of foreign currencies, a tailwind for overseas securities. Finally, bonds also showed some signs of stabilization as inflation readings indicated that maybe the peak in inflation is now in the rear-view mirror. Despite the 4th quarter positive news, it remains premature to wave the "all-clear" flag for the markets, as the economy will likely slow down in 2023.
Given the double-digit declines for stocks (S&P 500 -18.1%) and bonds (AGG -13%), all portfolio combinations of stock and bonds were down in 2022, with no regard to whether an investor invests conservatively (more bonds) or aggressively (more stocks). But we believe there are silver linings hiding within the negativity of the current moment; as we don’t believe stocks and bonds will continue to be as highly correlated, we feel bonds will go back to being a portfolio stabilizer, and history suggests that stocks tend to have robust returns after double-digit market declines.
The questions that remain are: How deep will the slowdown be? Will inflation continue to ebb? How much bad news is already priced into markets? How and when will the Fed react? A more modest slowdown, accompanied by lower inflation and a less restrictive Federal Reserve, is the goldilocks scenario that markets would welcome. However, any significant deviations from that – a deep or elongated slowdown, stubbornly high inflation, or a more restrictive Fed – would likely imply more difficulty in the near-term.
The Big Picture
On the economic front, the same questions (above) remain at the forefront of investors' minds - when will inflation start to recede, and how much and how long will economic growth slow down? The fourth quarter brought along some better news on the inflation and growth front, although many expect growth to fall as we enter 2023.
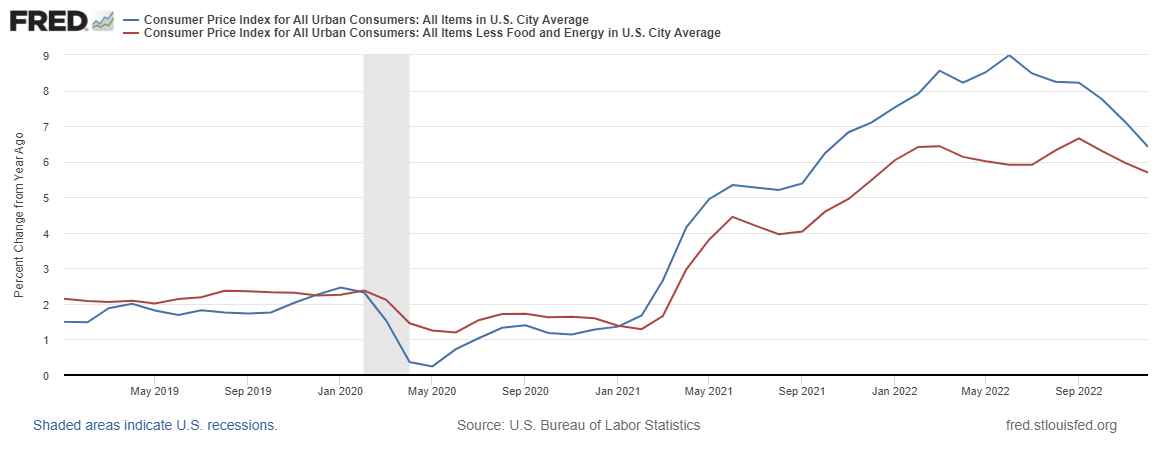
INFLATION: Inflation slowed for the sixth straight month in December. The Bureau of Labor Statistics announced the Consumer Price Index for All Urban Consumers (CPI-U) fell 0.1% in December on a seasonally adjusted basis, and core inflation rose by 0.3% month over month. The year-over-year rates were down to 6.5% and 5.7% (chart above), respectively, from 7.1% and 6.0% in November. However, the figures remain elevated and are still more than double the figures since the pre-covid period .
GROWTH (Gross Domestic Product): Following two consecutive quarters of negative GDP growth, 3Q22 real GDP showed the economy grew by a 3.2% annualized rate, benefitting from gains in trade. Investment spending is still holding up and the GDP price deflator, another measure of inflation, slowed to a 4.4% gain from the previous quarter compared to a 9% gain the quarter before. However, the economy is still losing momentum beneath the surface as real consumer spending continued to soften, and construction spending was very weak due to higher interest rates.
JOBS: In December, employers added 223,000 jobs, and the unemployment rate decreased to 3.5%, showing continued strength in the labor market. Overall, for 2022, the economy added 4.5 million jobs, the second-best year on record going back to 1940. Notably, the jobs reports did show a slight slowdown in wage growth in December. Wage growth increased 4.6% from the previous year, down from 4.8% in November and well below the peak in March. Slower wage growth would help ease inflationary pressures in the economy.
EARNINGS and ESTIMATES (2022 and 2023): Analysts expect 2022 S&P 500 earnings growth to deliver single-digit growth over an already strong 2021. However, according to Factset, most of the annual gain is attributed to the first half, when the 1st and 2nd quarters delivered growth of 9.4% and 5.8%, respectively. The 3rd quarter then slowed to a 2.5% rate, with 4th quarter earnings expected to decline by 3.9%. As of mid-January, analyst estimates for full-year 2023 were for a 4.6% earnings growth rate, with modest negative growth in in the year's first half, followed by a pickup in the final six months of 2023. The resilience, or lack thereof, of earnings will likely go a long way in determining the path of the stock market in 2023.
RATES AND THE FED: At its December meeting, the Fed maintained its stern messaging on monetary policy, hiking rates at a reduced pace of 0.50% per hike to a range of 4.25%-4.50%. Many were surprised by the Fed's updated Summary of Economic Projections, which forecasted higher unemployment, higher inflation, and slower growth in 2023 and 2024. The median FOMC member now expects a terminal Fed Funds Rate at or above 5% next year, suggesting at least another handful of rate hikes and causing concern against a backdrop of moderating inflation and potentially slower growth.
Market Performance
Global Stocks
For the 4th quarter, all 36 developed markets tracked by MSCI were positive. And for the 40 developing markets tracked by MSCI, 38 of them were positive as well.
- In the U.S., large companies outperformed small ones for the quarter and year, and value stocks beat growth stocks for the quarter and year.
- 9 of the 11 S&P 500 sectors delivered positive returns for the quarter, with six sectors higher by double-digits.
- The Energy, Industrial, and Materials sectors performed best for the quarter.
- The Communication Services and Consumer Discretionary sectors were the only two sectors to post losses in the final 3-months of 2022.
- Developed international market stocks had a robust quarter, given a decline in the U.S. dollar, leading them to outperform the U.S. market in a difficult 2022.
- Emerging Market stocks also outperformed U.S. stocks for the quarter and the year. Hungary, Poland, and Turkey delivered a strong positive performance for the quarter, while China bounced back late in the year.
Bonds
The bond markets' movement led to positive quarterly returns as income from higher interest rates offset minimal price declines. As a result, the highlights include the following:
- The 10-year Treasury bond yield increased another 0.05% for the quarter but was up a staggering 2.36% for the year, sending bond prices sharply lower in 2022. The yield curve continued to flatten and remained inverted (from 2 years to 10 years), often a harbinger of a recession on the horizon.
- Treasury Inflation-Protected Securities delivered modest positive returns, even as investors reduced their expectations for future inflation as economic growth concerns emerged.
- Asset-Backed Securities underperformed other bond market sectors for the quarter. Still, given their lower sensitivity to interest rates and steady cash flows, they delivered the best relative fixed income sector returns for the entire year.
- Credit spreads, a measure of the bond market's default risk, decreased modestly as investors demanded less compensation for assuming credit risk. Once again, the highest credit quality bonds provided lower returns than lower credit quality bonds.
- The Municipal market delivered the best return among sectors for the quarter, outperforming most other investment-grade sectors for the quarter and the full year.
Important Disclosure Information
This report is provided as information and commentary regarding the market. The views expressed in this report are as of the date of the report, and are subject to change based on market and other conditions. This report contains certain statements that may be deemed forward-looking statements. Please note that any such statements are not guarantees of any future performance and actual results or developments may differ materially from those projected.
Please note that nothing in this report post should be construed as an offer to sell or the solicitation of an offer to purchase an interest in any security or separate account. Nothing is intended to be, and you should not consider anything to be, investment, accounting, tax or legal advice. If you would like investment, accounting, tax or legal advice, you should consult with your own financial advisors, accountants, or attorneys regarding your individual circumstances and needs. Advice may only be provided by AtwoB after entering into an investment advisory or financial planning agreement. Moreover, you should not assume that any discussion or information contained in this newsletter serves as the receipt of, or as a substitute for, personalized investment and/or planning advice from AtwoB. If you are an AtwoB client, please remember to contact AtwoB, in writing, if there are any changes in your personal/financial situation or investment objectives for the purpose of reviewing/evaluating/revising our previous recommendations and/or services.
Past performance is not a guarantee of future returns. Investing involves risk and possible loss of principal capital. Different types of investments involve varying degrees of risk, and there can be no assurance that the future performance of any specific investment, investment strategy, or product (including the investments and/or investment strategies recommended or undertaken by AtwoB, or any non-investment related content, made reference to directly or indirectly in this newsletter will be profitable, equal any corresponding indicated historical performance level(s), be suitable for your portfolio or individual situation, or prove successful. Historical performance results for investment indices and/or categories have been provided for general comparison purposes only, and generally do not reflect the deduction of any fees or expenses, transaction and/or custodial charges, the deduction of an investment management fee, nor the impact of taxes, the incurrence of which would have the effect of decreasing historical performance results. It should not be assumed that your account holdings correspond directly to any comparative indices and/or categories.
AtwoB is neither a law firm nor a certified public accounting firm and no portion of the newsletter content should be construed as legal or accounting advice. A copy of the AtwoB's current written disclosure Brochure discussing our advisory services and fees continues to remain available upon request.
Index and Category Definitions
The S&P 500 Index is a capitalization-weighted index of 500 U.S. stocks. Russell 2000 TR USD is a market cap weighted index The Russell 2000 measuring the performance of approximately 2,000 smallest-cap American companies The MSCI All Country World ex-USA Index is a free float-adjusted market capitalization weighted index that is designed to measure the equity market performance of developed and emerging markets. The MSCI All Country World ex-USA Index consists of 22 developed and 24 emerging market country indices. The MSCI EAFE Index (Europe, Australasia, Far East) is a free float-adjusted market capitalization index that is designed to measure the equity market performance of developed markets, excluding the U.S. & Canada. The MSCI Emerging Markets (E.M.) Index is a free float-adjusted market capitalization index that is designed to measure equity market performance of 24 emerging markets countries. Bloomberg Barclays U.S. Aggregate Bond Index ("AGG") is an index of the U.S. investment-grade fixed-rate bond market, including both government and corporate bonds. ICE BofAML U.S. High Yield Index is an unmanaged index of below-investment grade U.S. corporate bonds. XZU Gold Spot $/Oz reflects the exchange rate of Gold against the U.S. dollar index