
Big Picture and Key Takeaway
4th Quarter 2025
(Click Here for Printable PDF)
Key Takeaway
2025 proved to be a historically strong year for markets despite headlines including April's tariff announcements, a government shutdown, the ongoing influence of artificial intelligence, the passage of the One Big Beautiful Bill Act, and geopolitical tensions. Despite these challenges, the fourth quarter concluded a positive year in which:
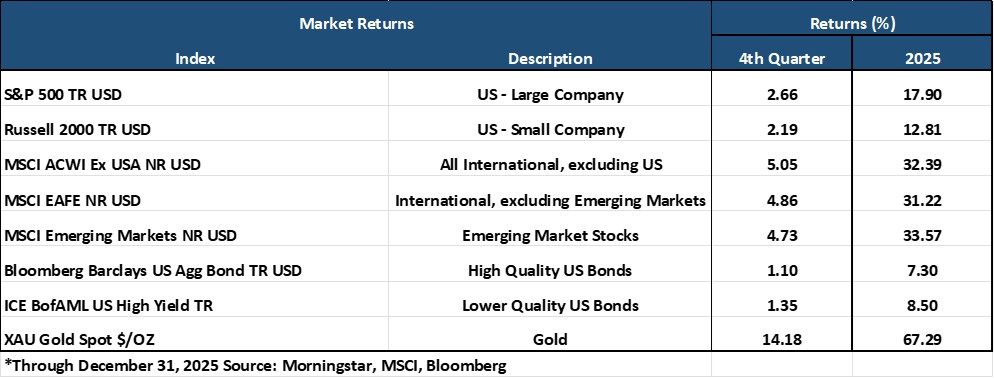
U.S. large-cap stocks (S&P 500, +17.9%) rose to new record highs, while smaller U.S. companies also saw a rally (R2000, +12.8%) due to expectations of a lower interest rate environment and ongoing economic growth.
International developed (MSCI EAFE, +31.2%) and emerging markets (MSCI EM, +33.6%) outperformed the U.S. for the year, benefiting from lower valuations and a weakening U.S. dollar, the latter of which declined by 9.3% for the year.
U.S. bonds continued their rebound from the 2022 lows (AGG, +7.3%), with the index delivering its best return since 2020.
Gold (+67.3%) led all asset classes on its way to record highs, finishing at $4,341 per ounce.
Several themes influenced markets in 2025 and will remain important in the coming year. In the U.S., the AI story was dominant, driving stock market gains and boosting economic growth. The Magnificent 7—Apple, NVIDIA, Microsoft, Amazon, Tesla, Alphabet, and Meta—now make up roughly one-third of the S&P 500’s market cap and contributed 42% of the index’s total return of 17.9%, with Alphabet and NVIDIA leading the way.
Second, while tariff policies generated uncertainty, their immediate economic impact was less severe than expected. Despite significant increases in import tariffs from many trading partners, the feared economic consequences have not fully occurred, as companies have adapted, tariffs have been paused or reduced, and robust consumer spending has mitigated some effects. The complete impact on inflation and growth may only become clear over time as companies modify their supply chains and pricing strategies.
Third, despite concerns about a weak jobs market in the 4th quarter, economic growth exceeded expectations. After a slow start to 2025, U.S. activity rebounded sharply and is expected to continue into 2026. However, growth varies across income groups, creating a "two-speed" or "K-shaped" economy, with some thriving and others struggling.
As we approach 2026, these market themes are expected to persist, alongside geopolitical risks and new uncertainties. The midterm elections in November could lead to short-term market volatility, while a leadership change at the Federal Reserve prompts questions about future monetary policies. With stock valuations close to those of the dot-com era, concerns about the sustainability of earnings growth and investor euphoria are growing.
History shows that uncertainty is common, with markets experiencing waves of innovation, political shifts, monetary policy changes, currency fluctuations, and disruptions. The key for investors is not to try predicting every possible future event, but to follow a disciplined investment strategy.
The Big Picture
As 2025 drew to a close, markets remained resilient despite persistent uncertainty. Financial market performance reflected confidence in a “soft-landing” economic narrative, supported by solid economic growth, moderating inflation, and a Federal Reserve that started easing its policy cautiously.
INFLATION: For December 2025, the Consumer Price Index for All Urban Consumers (CPI-U) increased by 0.3% on a seasonally adjusted basis, remaining steady compared to the previous month's 0.3% rise. Over the past 12 months, inflation has risen by 2.7%, unchanged from November. The core CPI (all items excluding food and energy) grew 0.2% in December and was up 2.6% year-over-year, remaining unchanged from November but exceeding the Fed’s target. Food costs rose 0.7% month over month, marking the largest increase since October 2022.
GROWTH (Gross Domestic Product): According to the U.S. Bureau of Economic Analysis (BEA), Real Gross Domestic Product (GDP) grew at an annual rate of 4.3% in the third quarter of 2025, following a 3.8% gain in the second quarter. The BEA attributed the Q3 acceleration to robust consumer spending, higher exports, and increased government spending, partly offset by weaker private investment. Exports turned upward as well, with gains in both goods and services. The second and third quarters reversed the negative trend in exports from the first quarter when companies stockpiled foreign goods. The Federal Reserve Bank of Atlanta’s GDPNow model estimated real GDP growth near 5.1% (seasonally adjusted annual rate) for the fourth quarter as of early January.
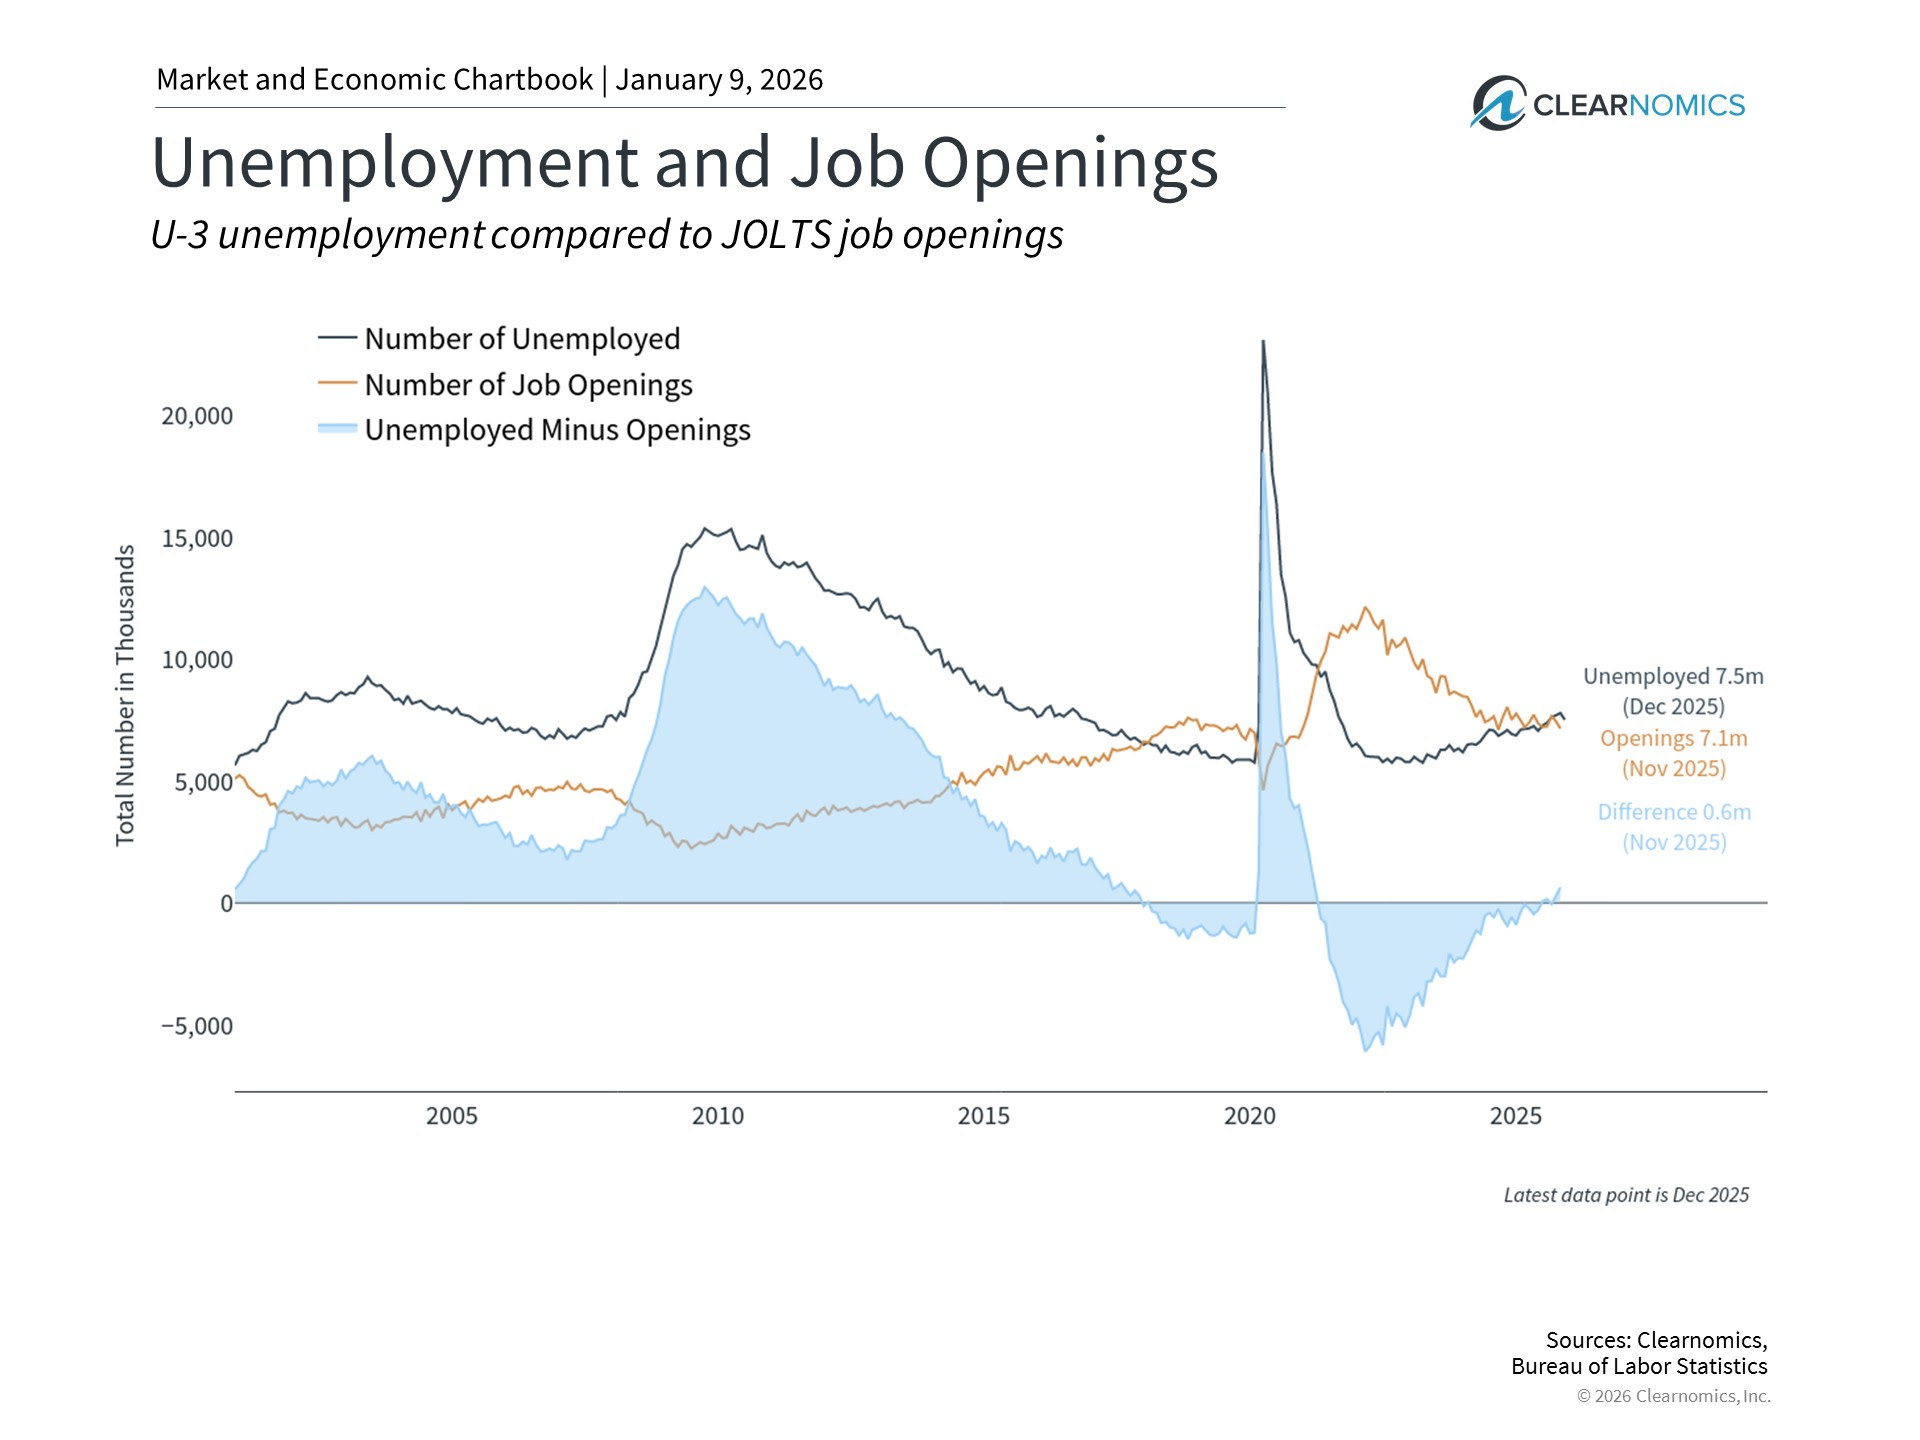
JOBS: The December employment report showed only 50,000 jobs added, with the unemployment rate dropping modestly to 4.4%. Overall, job creation slowed significantly in 2025, with just 584,000 jobs added compared to 2.0 million in 2024. There were three months of negative job growth, the most since 2020. This means the average monthly job growth was only 49,000, well below the 2024 average of 168,000. The average monthly change over the fourth quarter of 2025 was a loss of 22,000 jobs. A separate report showed that job openings have declined to 7.1 million (see chart). This indicates there are now fewer job openings than unemployed people, reversing the trend of recent years. It suggests companies may be hiring fewer people amid economic uncertainty.
EARNINGS and ESTIMATES: As of January 9th, according to the research firm FactSet, the S&P 500 is expected to report (year-over-year) earnings growth of 8.3% for the fourth quarter of 2025. If 8.3% is the actual growth rate for the quarter, it will mark the tenth consecutive quarter of year-over-year earnings growth for the index. Eight of the eleven sectors are projected to report year-over-year growth, led by Information Technology. Conversely, three sectors are expected to report year-over-year earnings declines, led by Consumer Discretionary. For the full year of 2026, analysts are projecting (year-over-year) earnings growth of 14.9%. At the start of the year, the forward 12-month P/E ratio for the S&P 500 stood around 22.2, above both its five‑year and ten‑year averages.
RATES AND THE FED: The Federal Reserve lowered the target range for the federal funds rate by 0.25% at its December meeting, bringing the range to 3.50%–3.75%—its third straight quarter‑point reduction. Minutes and commentary highlight that policymakers were divided, with three dissents reflecting differing views on the appropriate pace of easing amid a still‑resilient economy and inflation modestly above the 2% target. Market expectations for the timing of Fed rate cuts have recently fluctuated, with one or two cuts now forecast for 2026.
Market Performance
Global Stocks
Global equity markets delivered broadly positive returns in the fourth quarter, with developed and emerging markets alike outperforming the U.S. to close out a strong year of absolute and relative performance.
In the U.S., small companies underperformed large companies for the quarter, and value stocks beat growth stocks.
Nine of the eleven S&P 500 sectors delivered positive returns, demonstrating broad-based market strength.
Healthcare and Communication Services posted the best returns for the quarter, with Communications Services and Information Technology posting the highest returns for the year.
Real Estate and Utilities posted negative returns for the quarter, but all sectors generated positive returns for the year.
International developed market investors outperformed the U.S. for both the quarter and full year, driven by a weaker dollar, improving earnings trends, firmer economic data in select European and Asian economies, and renewed investor interest after years of underperformance.
Emerging markets nearly matched developed markets for the quarter and outperformed U.S. and developed markets for the year, highlighted by strength in China, Korea, Eastern Europe, and much of Latin America.
Bonds
The bond market posted a positive quarterly return as bond yields remained essentially flat. The highlights include:
- The 10-year Treasury bond yield increased by 0.02% for the quarter, leading to a positive return in U.S. Treasuries from the income produced during the quarter.
- Treasury Inflation-Protected Securities declined modestly and underperformed standard Treasuries as inflation expectations declined modestly from the end of September.
- U.S. mortgage-backed outperformed most other fixed-income sectors for the quarter and year as their high credit quality and attractive valuations, especially compared to corporate bonds, remain attractive to fixed-income investors.
- Credit spreads, a measure of the bond market's default risk, remained steady for the quarter. The highest-credit-quality bonds underperformed relative to lower-credit-quality bonds, which have higher income payments due to their lower credit quality.
- The Municipal market outperformed its taxable bond market counterparts, as yields on municipal bonds declined by a larger amount than equivalent-maturity Treasury Bonds.
Important Disclosure Information
This report is provided as information and commentary regarding the market. The views expressed in this report are as of the date of the report, and are subject to change based on market and other conditions. This report contains certain statements that may be deemed forward-looking statements. Please note that any such statements are not guarantees of any future performance and actual results or developments may differ materially from those projected.
Please note that nothing in this report post should be construed as an offer to sell or the solicitation of an offer to purchase an interest in any security or separate account. Nothing is intended to be, and you should not consider anything to be, investment, accounting, tax or legal advice. If you would like investment, accounting, tax or legal advice, you should consult with your own financial advisors, accountants, or attorneys regarding your individual circumstances and needs. Advice may only be provided by AtwoB after entering into an investment advisory or financial planning agreement. Moreover, you should not assume that any discussion or information contained in this newsletter serves as the receipt of, or as a substitute for, personalized investment and/or planning advice from AtwoB. If you are an AtwoB client, please remember to contact AtwoB, in writing, if there are any changes in your personal/financial situation or investment objectives for the purpose of reviewing/evaluating/revising our previous recommendations and/or services.
Past performance is not a guarantee of future returns. Investing involves risk and possible loss of principal capital. Different types of investments involve varying degrees of risk, and there can be no assurance that the future performance of any specific investment, investment strategy, or product (including the investments and/or investment strategies recommended or undertaken by AtwoB, or any non-investment related content, made reference to directly or indirectly in this newsletter will be profitable, equal any corresponding indicated historical performance level(s), be suitable for your portfolio or individual situation, or prove successful. Historical performance results for investment indices and/or categories have been provided for general comparison purposes only, and generally do not reflect the deduction of any fees or expenses, transaction and/or custodial charges, the deduction of an investment management fee, nor the impact of taxes, the incurrence of which would have the effect of decreasing historical performance results. It should not be assumed that your account holdings correspond directly to any comparative indices and/or categories.
AtwoB is neither a law firm nor a certified public accounting firm and no portion of the newsletter content should be construed as legal or accounting advice. A copy of the AtwoB's current written disclosure Brochure discussing our advisory services and fees continues to remain available upon request.
Index and Category Definitions
The S&P 500 Index is a capitalization-weighted index of 500 U.S. stocks. Russell 2000 TR USD is a market cap weighted index The Russell 2000 measuring the performance of approximately 2,000 smallest-cap American companies The MSCI All Country World ex-USA Index is a free float-adjusted market capitalization weighted index that is designed to measure the equity market performance of developed and emerging markets. The MSCI All Country World ex-USA Index consists of 22 developed and 24 emerging market country indices. The MSCI EAFE Index (Europe, Australasia, Far East) is a free float-adjusted market capitalization index that is designed to measure the equity market performance of developed markets, excluding the U.S. & Canada. The MSCI Emerging Markets (E.M.) Index is a free float-adjusted market capitalization index that is designed to measure equity market performance of 24 emerging markets countries. Bloomberg Barclays U.S. Aggregate Bond Index is an index of the U.S. investment-grade fixed-rate bond market, including both government and corporate bonds. ICE BofAML U.S. High Yield Index is an unmanaged index of below-investment grade U.S. corporate bonds. XZU Gold Spot $/Oz reflects the exchange rate of Gold against the U.S. dollar index.