
Big Picture and Key Takeaway
1st Quarter 2026
(Click Here for Printable PDF)
Key Takeaway
The first quarter of 2026 saw a significant shift in market conditions. The year started as a continuation of the 2025 rally with the S&P 500 hitting an all-time high near 7,020 on January 28, as earnings expectations remained solid and inflation appeared to be calming down. However, the market’s momentum changed after the Iran conflict intensified on February 28. The disruption in the Strait of Hormuz, an essential transportation route for global energy supplies, caused oil prices to surge and prompted investors to reevaluate inflation, growth, and policy outlooks, which were already being questioned prior to the conflict. As of this writing, the S&P has rebounded above 7,000, in the hope of a resolution to the conflict. For the quarter:
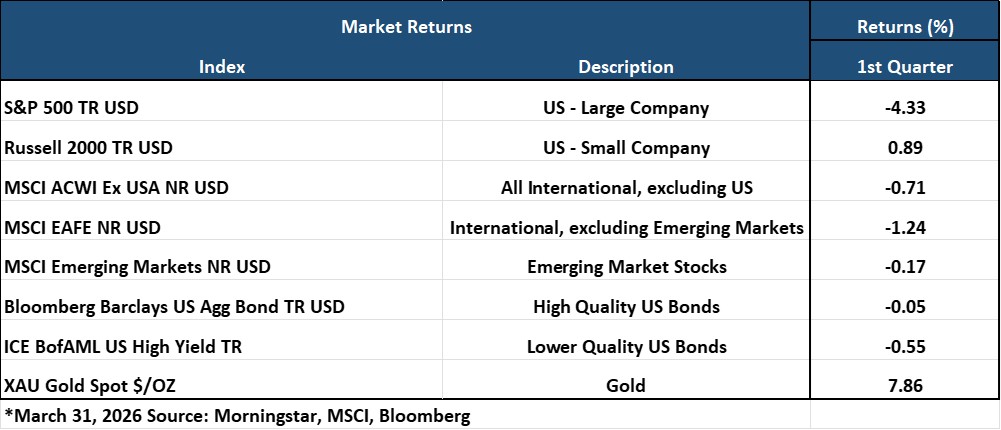
U.S. large-cap stocks declined (S&P 500, -4.3%), while smaller U.S. companies achieved modest gains (R2000, +0.9%). Given its dominance these last couple of years, the Magnificent 7 stocks all underperformed the broader market in 1Q as the AI landscape continues to evolve.
International developed (MSCI EAFE, -1.2%) and emerging markets (MSCI EM, -0.2%) declined modestly, but outperformed the U.S. for the quarter, despite a stronger dollar.
U.S. bonds were essentially flat (AGG, -0.05%), as interest rates increased on renewed inflation fears.
Gold (+7.9%) retreated from record highs of over $5,600 per ounce in late January but still finished higher to end the quarter at $4,732 per ounce (from $4,384 to start the year).
Iran and oil dominated the first quarter's narrative. For perspective, West Texas Intermediate (WTI) crude started the year around the mid-$60s per barrel, suggesting a globally oversupplied market. These sentiments suddenly changed when the flow of energy supplies through the Strait of Hormuz was effectively shut down. As a result, crude oil prices soared approximately 53% in March alone, its strongest monthly gain since May 2020, and currently hovers around $90 per barrel.
Given the increased risk of inflation from higher energy prices, the Fed kept its policy rate steady at 3.50% to 3.75% after its two meetings this year. This occurs despite ongoing concerns about economic growth and a weak job market. Most central banks worldwide have also paused their rate-cutting cycles, and some have even raised rates. With 10-year Treasury yields above 4%, bond markets are anticipating a longer period of higher rates than many investors expected at the start of the year.
Additionally, the events surrounding the Middle East have overshadowed growing challenges in the private credit sector. Signs of strain are becoming increasingly evident due to liquidity, valuations, and transparency concerns. As a result, recent redemption restrictions from well-known investment firms have put a “spotlight” on these risks.
The second quarter highlighted uncertainty, mainly over whether the Middle East stabilizes or there continues to be disruption in the energy markets. A prolonged disruption could keep risks high and raise inflation. Historically, markets experience quicker disruptions during geopolitical events and are deemed to be potentially short-lived. However, if energy prices remain high due to unresolved issues in the Middle East, it could induce a recession where historical market selloffs tend to be more protracted. It remains to be seen which path the economy will take due to the conflict. For now, the market is voting in favor of the former scenario rather than the latter.
Big Picture
The first quarter’s central economic theme was the tension between slower growth and renewed inflationary pressures. With growth already slowing before the energy shock, investors began to focus more seriously on stagflation risk.
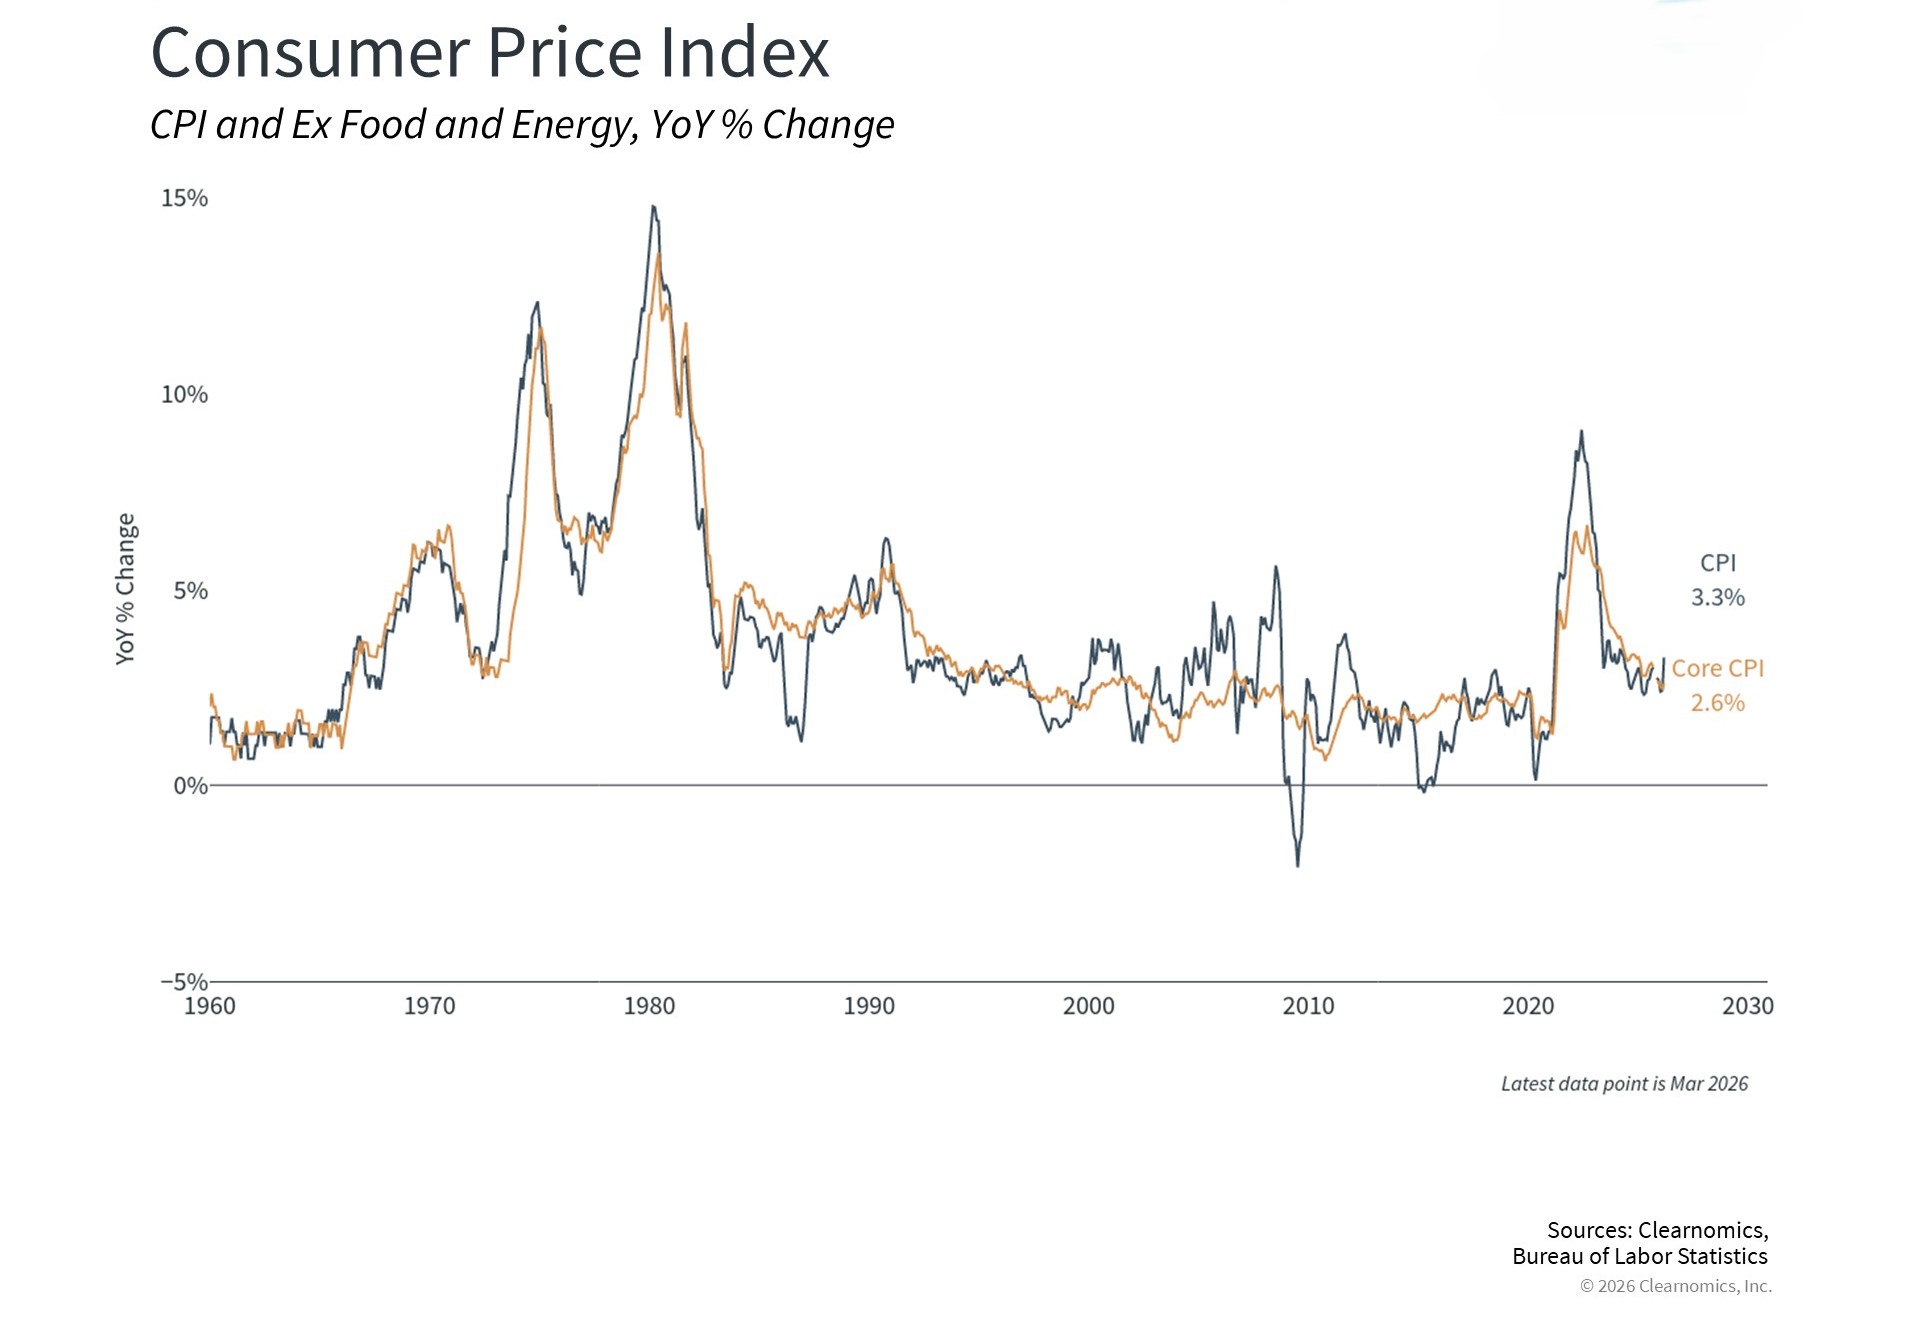
INFLATION: For March 2026, the Consumer Price Index for All Urban Consumers (CPI-U) increased by 0.9% on a seasonally adjusted basis from the prior month. Over the past 12 months, inflation has risen by 3.3%, almost a full percentage point increase from February’s annual pace. The core CPI (all items excluding food and energy) grew 0.2% in March from February and was up 2.6% year-over-year, up slightly from February and still exceeding the Fed’s target. The energy component of the index jumped 12.5 percent year-over-year, a couple of percentage points higher than analysts had been expecting.
GROWTH (Gross Domestic Product): According to the U.S. Bureau of Economic Analysis (BEA), the second estimate of fourth-quarter 2025 GDP came in at a 0.5% annualized rate—half the advance estimate and significantly below expectations. The revision reflected weaker readings on exports, consumer spending, government outlays, and investment. Part of the shortfall was attributed to disruptions from the October to November 2025 government shutdown, which complicated data collection and reporting. Even so, the number reinforced the view that the economy entered 2026 on a softer footing. The Federal Reserve Bank of Atlanta’s GDPNow model estimated real GDP growth near 1.6% (seasonally adjusted annual rate) for the fourth quarter as of early April.
JOBS: The U.S. added 178,000 jobs in March, a rebound from a revised loss of 133,000 in February, which was revised down. This means that the economy has averaged only about 15,000 jobs per month over the past six months, a very soft pace. The unemployment rate edged down slightly to 4.3%, but this partly reflects a shrinking labor force, as the share of Americans working or looking for work fell to 61.9%, its lowest since the fall of 2021. About 400,000 workers dropped out of the job market during this period. Wage growth remained modest, with average hourly earnings rising 3.5% over the past year, a slower pace than in recent years, while the average workweek also edged down slightly.
EARNINGS and ESTIMATES: Despite the turbulent quarter, the earnings backdrop heading into results season remained constructive. S&P 500 companies are expected to report year-over-year earnings growth of approximately 13.0%, according to FactSet estimates as of March 2026 for the first quarter. If that estimate holds, it would mark the sixth consecutive quarter of double-digit earnings growth. Revenue growth projections improved during the quarter as well, rising to 9.7% year-over-year from 8.2% at the beginning of the year. The forward twelve-month price-to-earnings ratio for the S&P 500 stood at 19.9 times at quarter-end, roughly in line with its five-year average.
RATES AND THE FED: The Federal Reserve left rates unchanged at both of its first-quarter meetings. The federal funds target range remained at 3.50% to 3.75%, where it has been since December 2025 following three consecutive 25-basis-point cuts in the second half of last year. Chair Jerome Powell struck a measured tone at the March press conference. He noted that policymakers had not made as much progress on inflation as they had hoped and acknowledged that the oil shock added a new layer of complexity to the outlook. The market’s focus shifted from how quickly the Fed might cut rates to whether renewed inflation would delay easing further or eliminate it entirely for the year.
Market Performance
Global Stocks
Global equity markets delivered modest negative returns in the first quarter, with developed and emerging markets alike outperforming the U.S.
In the U.S., small companies outperformed large companies for the quarter, and value stocks beat growth stocks.
Six of the eleven S&P 500 sectors delivered positive returns.
Energy posted the best return for the quarter by a wide margin due to much higher oil prices, with the Materials and Utilities sectors also providing strong returns.
Information Technology, Financials, and Consumer Discretionary posted high single-digit negative returns.
Despite a stronger dollar and a more significant pullback following the start of hostilities in Iran in late February, international developed market investors outperformed the U.S. for the quarter but still posted a small loss.
Emerging markets also experienced a small loss but outperformed the U.S. and other developed markets, despite China and India both facing a tough quarter.
Bonds
The bond market posted a flat quarterly return as bond yields increased modestly. The highlights include:
The 10-year Treasury bond yield increased by 0.15% for the quarter, leading to a negative return in U.S. Treasuries from price decline during the quarter.
Treasury Inflation-Protected Securities gained and outperformed standard Treasuries as inflation expectations increased from the end of December.
U.S. mortgage-backed securities outperformed most other fixed-income sectors for the quarter as their high credit quality and attractive valuations, especially compared to corporate bonds, remain attractive to fixed-income investors.
Credit spreads, a measure of the bond market's default risk, increased for the quarter. The highest-credit-quality bonds had similar performance to lower-credit-quality bonds, which have higher income payments due to their lower credit quality.
The Municipal market underperformed its taxable bond market counterparts, as yields on municipal bonds increased by a larger amount than equivalent-maturity Treasury Bonds.
Important Disclosure Information
This report is provided as information and commentary regarding the market. The views expressed in this report are as of the date of the report, and are subject to change based on market and other conditions. This report contains certain statements that may be deemed forward-looking statements. Please note that any such statements are not guarantees of any future performance and actual results or developments may differ materially from those projected.
Please note that nothing in this report post should be construed as an offer to sell or the solicitation of an offer to purchase an interest in any security or separate account. Nothing is intended to be, and you should not consider anything to be, investment, accounting, tax or legal advice. If you would like investment, accounting, tax or legal advice, you should consult with your own financial advisors, accountants, or attorneys regarding your individual circumstances and needs. Advice may only be provided by AtwoB after entering into an investment advisory or financial planning agreement. Moreover, you should not assume that any discussion or information contained in this newsletter serves as the receipt of, or as a substitute for, personalized investment and/or planning advice from AtwoB. If you are an AtwoB client, please remember to contact AtwoB, in writing, if there are any changes in your personal/financial situation or investment objectives for the purpose of reviewing/evaluating/revising our previous recommendations and/or services.
Past performance is not a guarantee of future returns. Investing involves risk and possible loss of principal capital. Different types of investments involve varying degrees of risk, and there can be no assurance that the future performance of any specific investment, investment strategy, or product (including the investments and/or investment strategies recommended or undertaken by AtwoB, or any non-investment related content, made reference to directly or indirectly in this newsletter will be profitable, equal any corresponding indicated historical performance level(s), be suitable for your portfolio or individual situation, or prove successful. Historical performance results for investment indices and/or categories have been provided for general comparison purposes only, and generally do not reflect the deduction of any fees or expenses, transaction and/or custodial charges, the deduction of an investment management fee, nor the impact of taxes, the incurrence of which would have the effect of decreasing historical performance results. It should not be assumed that your account holdings correspond directly to any comparative indices and/or categories.
AtwoB is neither a law firm nor a certified public accounting firm and no portion of the newsletter content should be construed as legal or accounting advice. A copy of the AtwoB's current written disclosure Brochure discussing our advisory services and fees continues to remain available upon request.
Index and Category Definitions
The S&P 500 Index is a capitalization-weighted index of 500 U.S. stocks. Russell 2000 TR USD is a market cap weighted index The Russell 2000 measuring the performance of approximately 2,000 smallest-cap American companies The MSCI All Country World ex-USA Index is a free float-adjusted market capitalization weighted index that is designed to measure the equity market performance of developed and emerging markets. The MSCI All Country World ex-USA Index consists of 22 developed and 24 emerging market country indices. The MSCI EAFE Index (Europe, Australasia, Far East) is a free float-adjusted market capitalization index that is designed to measure the equity market performance of developed markets, excluding the U.S. & Canada. The MSCI Emerging Markets (E.M.) Index is a free float-adjusted market capitalization index that is designed to measure equity market performance of 24 emerging markets countries. Bloomberg Barclays U.S. Aggregate Bond Index is an index of the U.S. investment-grade fixed-rate bond market, including both government and corporate bonds. ICE BofAML U.S. High Yield Index is an unmanaged index of below-investment grade U.S. corporate bonds. XZU Gold Spot $/Oz reflects the exchange rate of Gold against the U.S. dollar index.