
Big Picture and Key Takeaway
April 2020
From a market perspective, investors entered April worried that it might be a continuation of a dreadful March. Instead, April was in many ways the mirror image of March with the S&P 500 recording its biggest monthly gain since 1987. April can be described as a tale of two data sets, as investors saw the stock market turn in record-setting positive performance while digesting staggeringly poor economic data. The irresistible force in April was the massive downward pressure exerted on the global economy, while the immovable object was the Federal Reserve, which has unleashed a bazooka of stimulus measures into the financial markets. The anticipation of the former guided the market in March, while the latter won out in April.
April will be looked back upon as one of the worst months for the economy in history. The terrible economic data included weak manufacturing data, massive jobless claims, declining imports and exports, GDP contraction, and a sharp drop in personal spending. Specifically:
- Jobless claims surpassed 30 million, a mind-blowing percentage given the total labor force is about 163 million. The unemployment rate jumped to 14.7%, a post-World War 2 high.
- The ISM Manufacturing index reached its lowest level since April 2009
- U.S. exports fell 6.7% in March, and U.S. imports were down 2.4%
- Real GDP decreased at an annual rate of 4.8% in the first quarter
- Personal income fell 2%, as consumer spending fell 7.6% in March
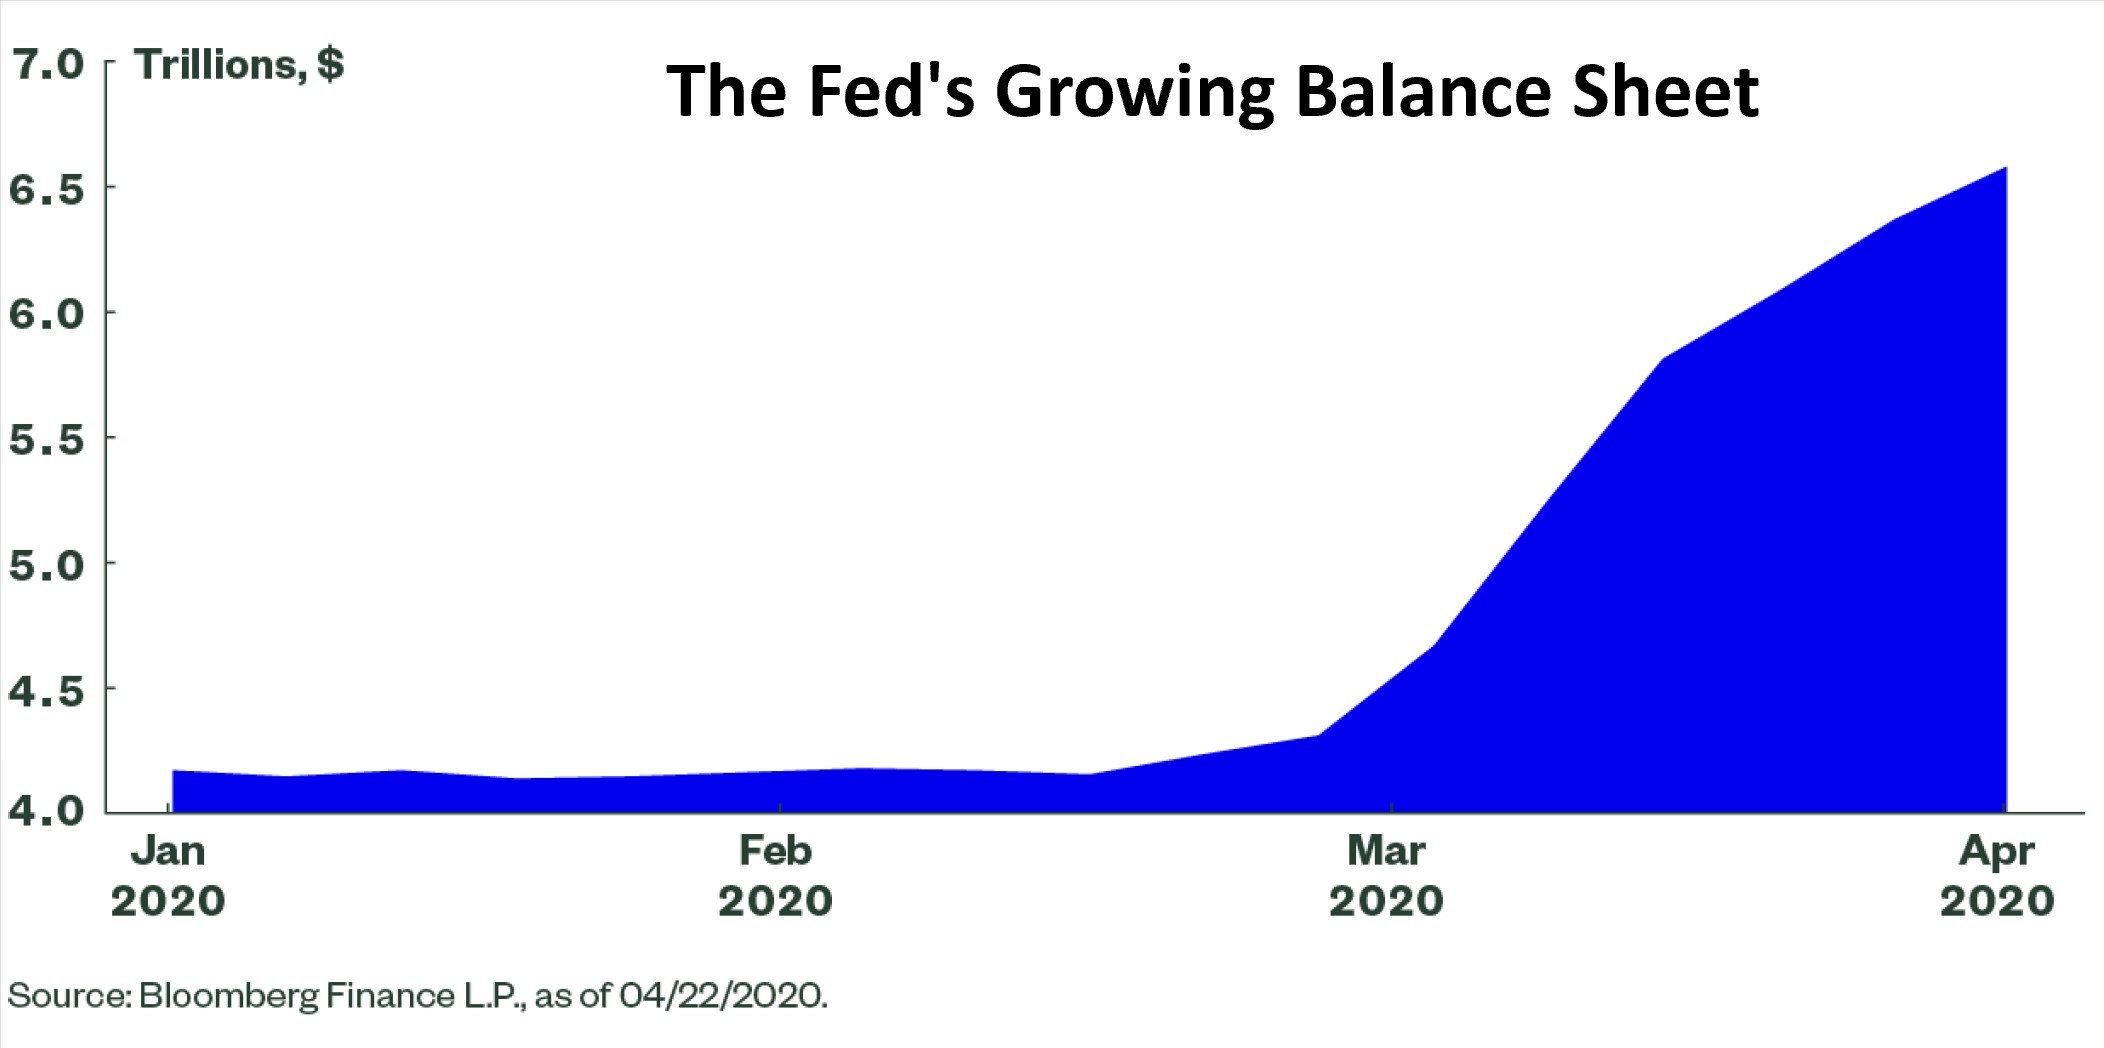
In contrast to the historically weak economic data, a massive tailwind for the market was the Federal Reserve's unprecedented expansion of its balance sheet to purchase bonds across the risk spectrum. The Fed's balance sheet has grown precipitously over the past month (see chart above), by over $2 trillion, as they support nearly every area of the credit market using an alphabet soup of legacy and newly created credit lending facilities. Investors were comforted by the thought that the Fed would not let the financial system crater, removing a significant market risk. The Fed also unanimously voted to keep the Fed Funds rate target at 0.00-0.25% and hinted that rates might stay there for a while.
The Key Takeaway
As we write this, the S&P 500 trades at a level that we witnessed back in – October of 2019. Really? It seems strange given the economic damage we are undergoing, but the magnitude of April's rally was quite substantial, in stark contrast to the depression-like nature of recent economic data. Fiscal and monetary stimulus measures have clearly lifted the mood of the market, as it looks past the damage and focuses on the potential for recovery. The trillion-dollar question today is, What will the recovery look like? On that question, we believe the market may be getting ahead of itself, given the myriad of potential health and economic risks still ahead.
April Market Performance
Global Stocks
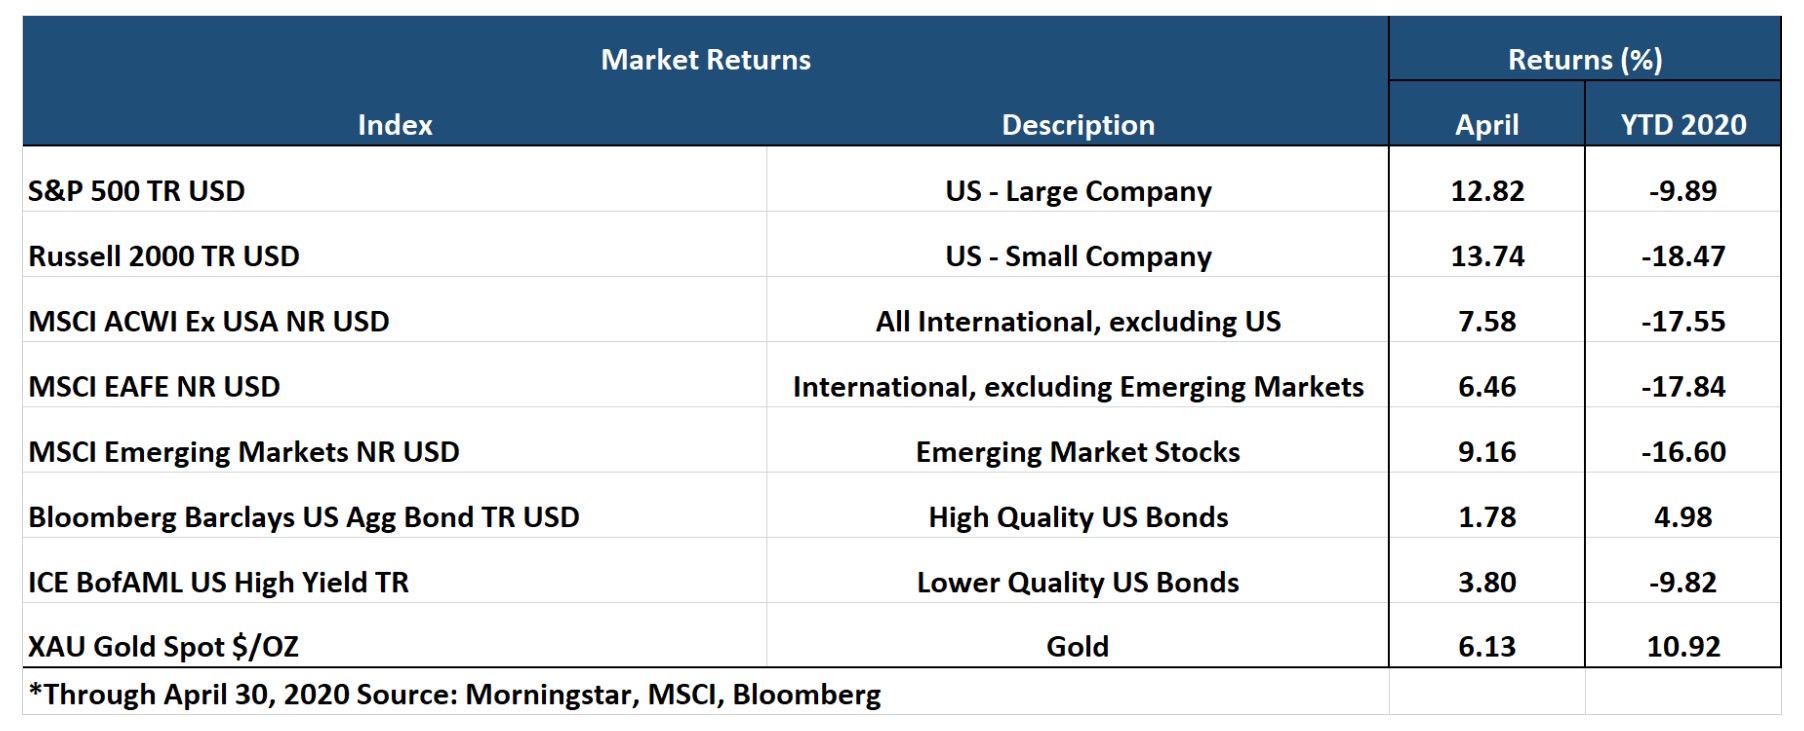
For the global stock market, the difference from March to April was remarkable. After the massive shock to markets around the world in March, April saw big rebounds in almost every region. Of the 35 developed markets tracked by MSCI, all of them were positive, and of the 43 emerging markets tracked by MSCI, all of them were positive too. Within the U.S. stock market, which continued to outperform its international brethren, smaller companies outperformed large companies, and growth names continued to outperform value names. After March saw every single one of the 11 S&P 500 sectors lose money, April saw all of them produce gains. The worst performing sector last month, Energy, was the best performing in April - followed by a strong performance from the Consumer Discretionary and Material sectors. The more defensive Utility and Consumer Staples sectors turned in the least impressive returns, although still positive.
Bonds
Bond yields remained historically low across Treasury bond maturities. The 10-year Treasury bond yield dropped by nearly 0.06% in April and is down approximately 1.26% for 2020. Once again, the movement within the bond market led to positive gains for the month. Unlike March, April witnessed the most credit-sensitive securities fare the best as the Federal Reserve stepped in to purchase both Investment-Grade and High Yield corporate bonds – yet another unprecedented development. Bonds with the lowest investment-grade rating of BBB delivered the best performance. Credit spreads, a measure of the risk of default in the bond market, declined significantly from their elevated levels of March, but remain quite high relative to historical averages. In stark contrast to the taxable bond market, tax-exempt municipal bonds declined in value in April as the pandemic is delivering a fiscal blow to states, cities, and localities. While there has been some discussion of sending more money to the states for relief, funding does not appear imminent as a political debate ensues.
Important Disclosure Information
This report is provided as information and commentary regarding the market. The views expressed in this report are as of the date of the report, and are subject to change based on market and other conditions. This report contains certain statements that may be deemed forward-looking statements. Please note that any such statements are not guarantees of any future performance and actual results or developments may differ materially from those projected.
Please note that nothing in this report post should be construed as an offer to sell or the solicitation of an offer to purchase an interest in any security or separate account. Nothing is intended to be, and you should not consider anything to be, investment, accounting, tax or legal advice. If you would like investment, accounting, tax or legal advice, you should consult with your own financial advisors, accountants, or attorneys regarding your individual circumstances and needs. Advice may only be provided by AtwoB after entering into an investment advisory or financial planning agreement. Moreover, you should not assume that any discussion or information contained in this newsletter serves as the receipt of, or as a substitute for, personalized investment and/or planning advice from AtwoB. If you are an AtwoB client, please remember to contact AtwoB, in writing, if there are any changes in your personal/financial situation or investment objectives for the purpose of reviewing/evaluating/revising our previous recommendations and/or services.
Past performance is not a guarantee of future returns. Investing involves risk and possible loss of principal capital. Different types of investments involve varying degrees of risk, and there can be no assurance that the future performance of any specific investment, investment strategy, or product (including the investments and/or investment strategies recommended or undertaken by AtwoB, or any non-investment related content, made reference to directly or indirectly in this newsletter will be profitable, equal any corresponding indicated historical performance level(s), be suitable for your portfolio or individual situation, or prove successful. Historical performance results for investment indices and/or categories have been provided for general comparison purposes only, and generally do not reflect the deduction of any fees or expenses, transaction and/or custodial charges, the deduction of an investment management fee, nor the impact of taxes, the incurrence of which would have the effect of decreasing historical performance results. It should not be assumed that your account holdings correspond directly to any comparative indices and/or categories.
AtwoB is neither a law firm nor a certified public accounting firm and no portion of the newsletter content should be construed as legal or accounting advice. A copy of the AtwoB's current written disclosure Brochure discussing our advisory services and fees continues to remain available upon request.
Index and Category Definitions
The S&P 500 Index is a capitalization-weighted index of 500 U.S. stocks. Russell 2000 TR USD is a market cap weighted index The Russell 2000 measuring the performance of approximately 2,000 smallest-cap American companies The MSCI All Country World ex-USA Index is a free float-adjusted market capitalization weighted index that is designed to measure the equity market performance of developed and emerging markets. The MSCI All Country World ex-USA Index consists of 22 developed and 24 emerging market country indices. The MSCI EAFE Index (Europe, Australasia, Far East) is a free float-adjusted market capitalization index that is designed to measure the equity market performance of developed markets, excluding the U.S. & Canada. The MSCI Emerging Markets (E.M.) Index is a free float-adjusted market capitalization index that is designed to measure equity market performance of 24 emerging markets countries. Bloomberg Barclays U.S. Aggregate Bond Index is an index of the U.S. investment-grade fixed-rate bond market, including both government and corporate bonds. ICE BofAML U.S. High Yield Index is an unmanaged index of below-investment grade U.S. corporate bonds. XZU Gold Spot $/Oz reflects the exchange rate of Gold against the U.S. dollar index