
Big Picture and Key Takeaway
2nd Quarter 2020
Key Takeaway
The contrast between the depression-like nature of recent economic data and the amazing recovery of the financial markets has been remarkable. Fiscal and monetary stimulus measures have lifted the mood of the markets, but there are also many optimistic assumptions now built into the economic and earnings outlook. One assumption is the worst of the virus is behind us, which is being challenged by data showing a surge in cases outside the Northeast Corridor. If the virus remains stubbornly persistent, that may place a significant dent in the current expectations of V-shaped economic and earnings recovery that are partially responsible for the stellar 2nd quarter market performance.
The Big Picture
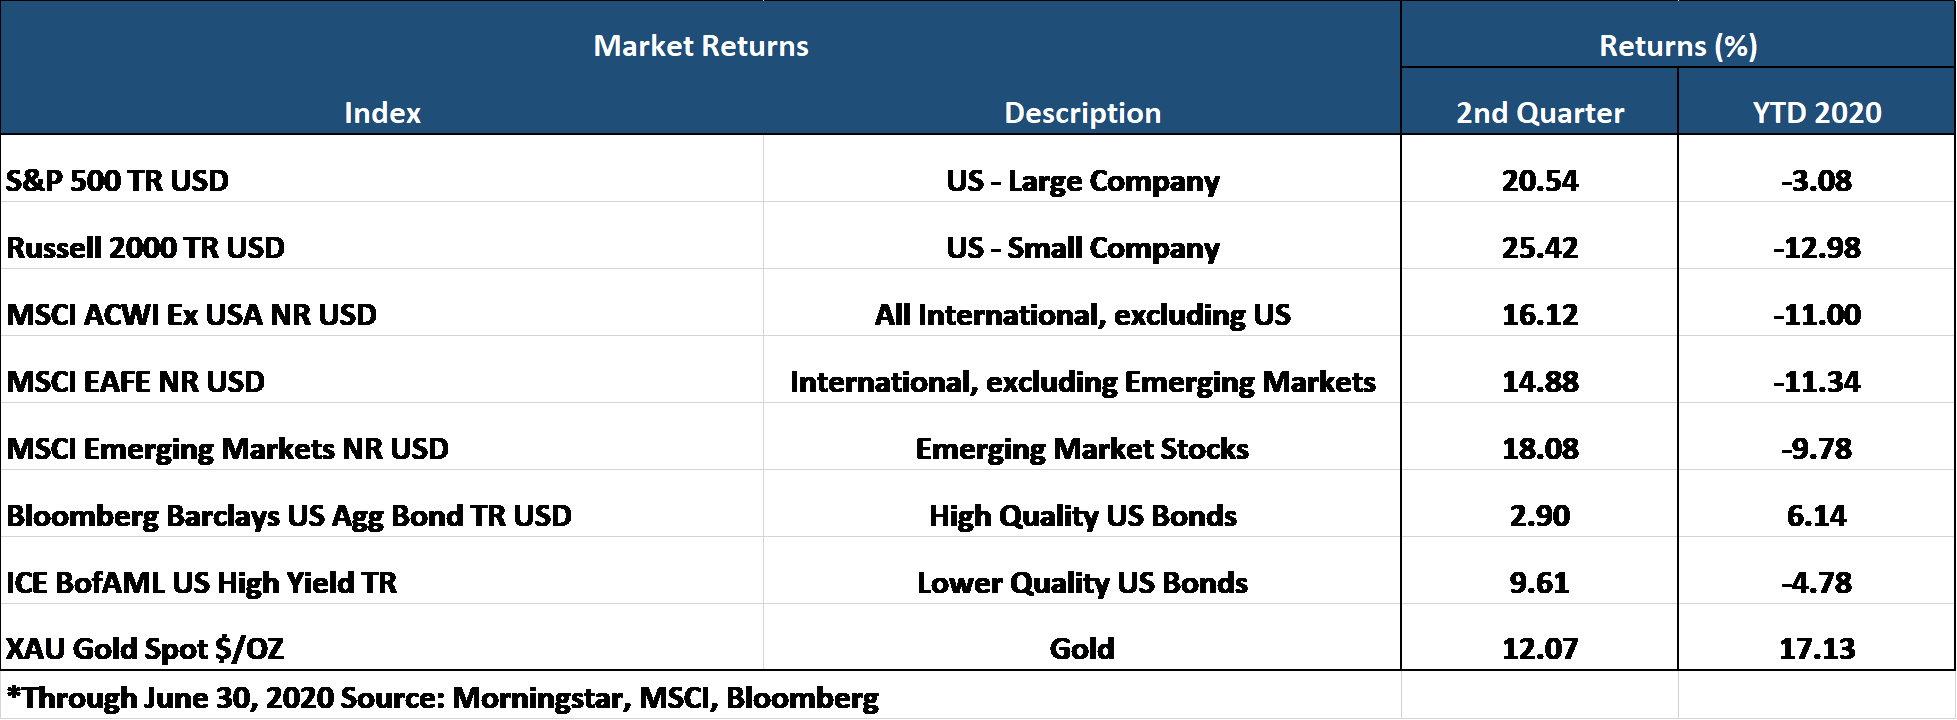
After a dismal start to 2020 and the S&P 500's fastest decline of 30% in history, global stock markets rebounded sharply in the 2nd quarter. Following the worst quarter since late 2008, the S&P 500 gained 20.5% and recorded its best quarter since the 4th quarter of 1998. The financial markets did their best to ignore the constant barrage of negative economic news, preferring to look forward in the hope of an impending recovery while setting aside worries about the potential future impact of the virus. Additionally, massive government fiscal and monetary stimulus has helped to counter the devastating economic effects of the pandemic. Despite the sharp recovery in the 2nd quarter, global stock markets remain underwater through the first half of 2020.
On the economic front, the previous few months witnessed an unprecedented and immediate stoppage of economic activity as businesses shut down and people stayed at home. With the economic engine at a virtual standstill, there were massive swings in the economic numbers from month to month. For example:
- Jobless claims surpassed 41 million at one point during the quarter, a mind-blowing percentage given the total labor force is about 163 million.
- The unemployment rate, which increased to nearly 15% in April, has dropped to 11.1% in June. While the unemployment rate is improving, permanent job losses appear to be increasing each month as an overall percentage of layoffs.
- The Bureau of Economic Analysis said U.S. economic growth, defined by real gross domestic product, decreased at an annual rate of 5.0% in the first quarter of 2020. The second quarter will look considerably worse, as the Atlanta Fed's GDPNow forecast is at an annual rate of -34.7%. 3rd quarter numbers are expected to bounce back sharply, but projections are already being dialed back as recent virus statistics look more ominous.
In response to the economic contraction and uncertainty, the Federal Reserve committed to keeping a floor underneath the amount of bonds it purchases at over $120 billion per month, and also forecasted they would hold the Federal Funds Rate at 0% through 2022. There is also a recognition by Congress that they will need to pass yet another fiscal stimulus package to help mitigate the ongoing damage from the virus.
Market Performance
Global Stocks
For the 2nd quarter, all of the 35 MSCI regional stock indices and 37 country indices were positive. The U.S. stock market continued to outperform its international counterparts. Additional highlights include:
- In the U.S., small companies outperformed large companies, and growth stocks continued to outperform value stocks.
- All of the 11 S&P 500 sectors delivered positive returns for the 2nd quarter, led by a stellar performance from the Information Technology and Consumer Discretionary sectors.
- Although still down dramatically for the year, the Energy sector bounced back sharply after a dismal 1st quarter as oil prices doubled from $20 to $40.
- The traditionally defensive Utility sector turned in the worst performance.
- Year-to-date, the difference between the best and worst-performing sectors has been stark, with the Information Technology sector up over 14% while the Energy sector is down a whopping 37%.
Bonds
Overall, the movement within the bond markets led to positive gains for the quarter as bond yields remained historically low across Treasury bond maturities. Additional highlights include:
- The 10-year Treasury bond yield decreased by a slight 0.04% for the quarter after a sharp move down in March, and the yield curve steepened modestly as shorter-term rates declined more than longer-term rates.
- In general, corporate bonds delivered the best performance among fixed income sectors, as the sector was a prime beneficiary of the Fed's new bond purchase programs.
- The most credit-sensitive securities generally fared best, as lower-quality bonds delivered the best performance within the investment-grade space. At the same time, non-investment-grade bonds (high yield) also performed very well, delivering near double-digit returns.
- Credit spreads, a measure of the risk of default in the bond market, continued their steady declines from the distressed levels in March, but remain quite high relative to historical averages.
- Despite rebounding from a terrible March and April, tax-exempt municipal bonds trail its taxable counterparts by a wide margin year to date.
Important Disclosure Information
This report is provided as information and commentary regarding the market. The views expressed in this report are as of the date of the report, and are subject to change based on market and other conditions. This report contains certain statements that may be deemed forward-looking statements. Please note that any such statements are not guarantees of any future performance and actual results or developments may differ materially from those projected.
Please note that nothing in this report post should be construed as an offer to sell or the solicitation of an offer to purchase an interest in any security or separate account. Nothing is intended to be, and you should not consider anything to be, investment, accounting, tax or legal advice. If you would like investment, accounting, tax or legal advice, you should consult with your own financial advisors, accountants, or attorneys regarding your individual circumstances and needs. Advice may only be provided by AtwoB after entering into an investment advisory or financial planning agreement. Moreover, you should not assume that any discussion or information contained in this newsletter serves as the receipt of, or as a substitute for, personalized investment and/or planning advice from AtwoB. If you are an AtwoB client, please remember to contact AtwoB, in writing, if there are any changes in your personal/financial situation or investment objectives for the purpose of reviewing/evaluating/revising our previous recommendations and/or services.
Past performance is not a guarantee of future returns. Investing involves risk and possible loss of principal capital. Different types of investments involve varying degrees of risk, and there can be no assurance that the future performance of any specific investment, investment strategy, or product (including the investments and/or investment strategies recommended or undertaken by AtwoB, or any non-investment related content, made reference to directly or indirectly in this newsletter will be profitable, equal any corresponding indicated historical performance level(s), be suitable for your portfolio or individual situation, or prove successful. Historical performance results for investment indices and/or categories have been provided for general comparison purposes only, and generally do not reflect the deduction of any fees or expenses, transaction and/or custodial charges, the deduction of an investment management fee, nor the impact of taxes, the incurrence of which would have the effect of decreasing historical performance results. It should not be assumed that your account holdings correspond directly to any comparative indices and/or categories.
AtwoB is neither a law firm nor a certified public accounting firm and no portion of the newsletter content should be construed as legal or accounting advice. A copy of the AtwoB's current written disclosure Brochure discussing our advisory services and fees continues to remain available upon request.
Index and Category Definitions
The S&P 500 Index is a capitalization-weighted index of 500 U.S. stocks. Russell 2000 TR USD is a market cap weighted index The Russell 2000 measuring the performance of approximately 2,000 smallest-cap American companies The MSCI All Country World ex-USA Index is a free float-adjusted market capitalization weighted index that is designed to measure the equity market performance of developed and emerging markets. The MSCI All Country World ex-USA Index consists of 22 developed and 24 emerging market country indices. The MSCI EAFE Index (Europe, Australasia, Far East) is a free float-adjusted market capitalization index that is designed to measure the equity market performance of developed markets, excluding the U.S. & Canada. The MSCI Emerging Markets (E.M.) Index is a free float-adjusted market capitalization index that is designed to measure equity market performance of 24 emerging markets countries. Bloomberg Barclays U.S. Aggregate Bond Index is an index of the U.S. investment-grade fixed-rate bond market, including both government and corporate bonds. ICE BofAML U.S. High Yield Index is an unmanaged index of below-investment grade U.S. corporate bonds. XZU Gold Spot $/Oz reflects the exchange rate of Gold against the U.S. dollar index