
Big Picture and Key Takeaway
1st Quarter 2024
(Click here for Printable PDF)
Key Takeaway
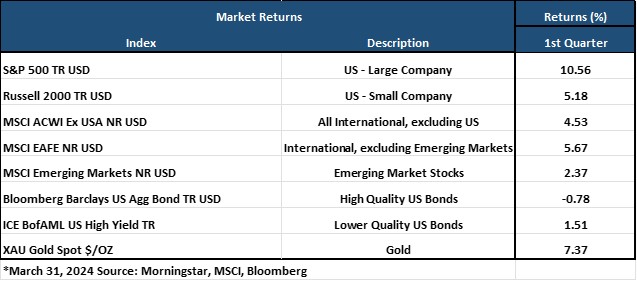
The global stock market rally continued in the 1st quarter, following a strong performance in 2023. For the quarter, U.S. Large cap stocks increased (S&P 500 +10.6%) along with developed international stocks (MSCI EAFE +5.8%). The broad-based bond market declined during the quarter (AGG -0.8%), with bond interest rates increasing as stubborn inflation readings have pushed out expectations for Federal Reserve rate cuts. In a sign of potential further geopolitical angst, Gold also hit record highs in the first quarter.
Inflation. Inflation. Inflation. It remains the main event for financial markets as it shifts expectations for monetary policy. Entering 2024, the combination of declining inflation and sustained, but not overheating, economic growth set the expectation that the Fed would likely reduce interest rates as early as March. Inflation, however, did not cooperate in the first 3 months of the year, and the “last mile” of getting inflation into the Fed’s 2% comfort zone is proving more challenging. The proverbial “can” has been kicked further down the road for when the rate cuts may start, and expectations are being pushed back into the fall.
Typically, these developments would provide pause for the stock market, given earlier expectations that the Fed would be cutting rates by now. However, the narrative seemed to subtly shift in the first quarter to good economic news actually resonating with stocks due to continued earnings growth supporting current market valuations. Conversely, with another higher-than-expected inflation reading in March, it will be interesting to see if the market re-focuses on the theme of “higher interest rates for longer” instead of the “economy is looking stronger.” If so, choppier seas may be ahead for financial markets, which is playing out in the beginning of the second quarter.
While large U.S. stocks have continued to perform well, driven by the ever-increasing valuations of the largest handful of stocks in the S&P 500 Index, we believe the opportunity set beyond U.S. large company stocks has more attractive valuations and provides essential diversification benefits. International, small company U.S., high-quality value U.S. stocks and real assets are priced inexpensively compared to the largest companies of the U.S. market. Furthermore, despite the headwinds over the past few years for the fixed income market during a rising interest rate environment, higher yields should serve to limit the downside if rates stay higher for longer. In addition, bonds may soon return to being the ballast of a portfolio and produce attractive returns if an economic slowdown or an unfavorable shift with stock market sentiment materializes.
The Big Picture
Overall, the outlook for the U.S. economy in the first quarter of 2024 could best be described as cautiously optimistic, with expectations of continued moderate growth and an economic soft landing despite ongoing inflation-related challenges. The U.S. economy has proven resilient amidst geopolitical tensions, fluctuating interest rates, and varying inflation expectations – with the labor market producing a continued strong start to the year.
INFLATION: In March, the Bureau of Labor Statistics announced the Consumer Price Index for All Urban Consumers (CPI-U) increased by 0.4% from February on a seasonally adjusted basis. Core inflation (all items less food and energy) also rose by 0.4% month-over-month. The year-over-year rates were 3.5% and 3.8%, respectively, from 3.2% and 3.8% in February,
and is no longer slowing down as policymakers might have hoped (see chart). Of particular note, housing costs, a significant component of the overall inflation calculation, remained relatively high in March and were up 5.7% from a year earlier. While housing inflation has cooled since last year, when it was up over 8%, the pace of its decline has stalled as of late.

GROWTH (Gross Domestic Product): In the fourth quarter of 2023, the U.S. GDP grew at an annual rate of 3.4%, a decrease from the 4.9% growth seen in the third quarter. This growth was fueled by increases in consumer spending, state and local government spending, exports, nonresidential fixed investment, federal government spending, and, notably, residential fixed investment. However, a decrease in private inventory investment partially offset this expansion. Looking ahead to the first quarter of 2024, the Federal Reserve Bank of Atlanta's GDPNow forecasting model predicts a slower annualized growth rate of 2.4%.
JOBS: The March 2024 jobs report revealed a solid increase in employment, with nonfarm payroll employment rising by 303,000 jobs while the unemployment rate unchanged at 3.8%. This increase was widespread, notably in health care, government, and construction sectors. The report reflects a labor market that continues to demonstrate resilience amidst high interest rates and persistent inflation, with job gains significantly exceeding expectations. However, there was evidence of a slowdown in wage growth, which might alleviate some concerns about inflation driven by labor market conditions. On the wage front, average hourly earnings saw a moderate increase of 0.3% for the month, aligning with expectations, and experienced a 4.1% rise on an annual basis - the slowest pace since mid-2021.
EARNINGS and ESTIMATES: On the last day of the quarter, research firm FactSet reported that for Q1 2024, the estimated (year-over-year) earnings growth rate for the S&P 500 is 3.6%. If 3.6% is the actual growth rate for the quarter, it would mark the third straight quarter of year-over-year earnings growth for the index. On December 31st, the estimated (year-over-year) earnings growth rate for the S&P 500 for Q1 2024 was 5.8%, so expectations have moderated over the last three months. The forward 12-month price/earnings ratio (P/E) for the S&P 500 is 20.9, which is above the 5-year average (19.1) and above the 10-year average (17.7).
RATES AND THE FED: At the March meeting, the Federal Reserve decided to maintain the federal funds rate at the current range of 5.25% to 5.5%, marking the fifth consecutive meeting holding steady rates. This decision keeps the federal funds rate at its highest target range in over 22 years. The Federal Reserve's Chair, Jerome Powell, highlighted that while a soft economic landing remains uncertain, the risks to achieving the Fed's employment and inflation goals are becoming more balanced. Moreover, the Federal Reserve signaled the possibility of three rate cuts in 2024, which was welcomed by the markets. Powell indicated that any upcoming policy rate cut would be data-dependent, mainly focusing on labor market conditions and achieving greater confidence that inflation has sustainably moved towards the Fed's 2% target.
Market Performance
Global Stocks
For the 1st quarter, 34 of the 36 developed markets tracked by MSCI were positive. And of the 40 developing markets tracked by MSCI, 27 were also positive.
- In the U.S., large companies outperformed small companies for the quarter, and growth stocks beat value stocks – highlighted by the performance of generative AI-related stocks like chipmaker NVIDIA.
- 10 of the 11 S&P 500 sectors delivered positive returns.
- The Technology, Communication Services, and Financial sectors performed best for the quarter, while the Energy sector joined them in leading the market higher as oil prices increased in March.
- Real Estate was the lone down sector as higher interest rates weighed on the rate-sensitive category.
- Developed international market stocks also posted gains in the first quarter despite a strong rally in the U.S. dollar – which is a headwind for international stock performance.
- Developing Market stocks delivered positive performance, although they underperformed relative to U.S. and Developed International stocks for the quarter. Turkey, Peru, and Taiwan led the way, while China delivered a quarter of negative returns following a difficult 2023.
Bonds
The bond market posted a negative return as bond interest rates increased appreciably to start the year. The highlights include the following:
- The 10-year Treasury bond yield increased by 0.32% for the quarter, reversing approximately half of the sharp rate decline that occurred towards the end of 2023. The rate increase led to modest declines in the U.S. Treasury market to start the year, as the market repriced expectations of when the Federal Reserve would cut rates.
- Treasury Inflation-Protected Securities outperformed standard Treasuries to post modest positive returns, as inflation expectations increased throughout the quarter on the heels of stubborn inflation readings.
- U.S. asset-backed securities delivered solid returns relative to other sectors, given their shorter duration, solid credit fundamentals, and attractive yields.
- Credit spreads, a measure of the bond market's default risk, continued to decline in the first three months of the year. The highest credit quality bonds provided lower returns than lower credit quality bonds, which have higher income payments due to their inferior credit quality.
- The Municipal market delivered a negative return but modestly outperformed its taxable bond market counterparts as yields on municipal bonds increased slightly less than equivalent maturity Treasury Bonds.