
Big Picture and Key Takeaway
1st Quarter 2021
Key Takeaway
Given that investors witnessed interest rates rise, oil prices jump, a reappearance of inflation worries, and continued headwinds from COVID-19, first quarter returns for the U.S. and international stock markets were resilient. The themes that drove the stock market in the first quarter were mostly positive economic data, the passing of another massive stimulus package, and more COVID vaccines being distributed around the world. While investors could find plenty to worry about, especially as interest rates increased sharply, leading to declines in bonds, stock markets seemed to generally ignore most of the negative chatter on their ways to new highs. While direct stimulus has clearly been well received, signs of inflation and potentially higher taxes are risks to keep an eye on.
The Big Picture
Despite a few spikes of volatility throughout the first quarter, global equity markets continued their surge from the fourth quarter of 2020, with the U.S. markets reaching new highs. While there was a sharp rise in interest rates during the first three months of 2021, generally a headwind for stocks, the markets reacted positively to additional stimulus as well as faster vaccine rollouts. High-quality bonds, led by U.S. Treasury Bonds, generally declined in price as interest rates moved higher.
Economically, positive news during the quarter included:
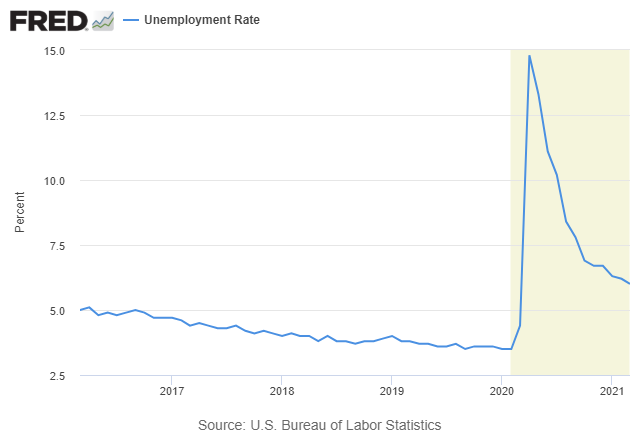
- A robust March nonfarm payroll report, which reflected an increase of 916,000 jobs, and an unemployment rate drop from 6.2% to 6.0%.
- Real estate continues to be a positive for the economy, as the median existing-home price for all housing types in February was $313,000, up 15.8% from February 2020 ($270,400), as prices rose in every region.
- The Bureau of Economic Analysis announced that Real Gross Domestic Product increased at an annual rate of 4.3% in the last quarter of 2020.
On the negative side of the economic ledger:
- Following nine consecutive monthly increases, new orders for manufactured durable goods in February decreased $2.9 billion or 1.1 percent to $254.0 billion.
President Biden signed another $1.9 trillion COVID-relief bill, which will provide additional relief to small businesses and direct payments to individuals and families. Additionally, as the quarter was wrapping up, the White House introduced a massive $2 trillion infrastructure spending bill. While the total amount of stimulus and government spending remains to be seen, adding the $900 billion package signed in late 2020 to the most recent $1.9 trillion package signed equates to almost 15% of U.S. GDP. For now, Wall Street is reacting favorably to all this government spending.
Market Performance
Global Stocks
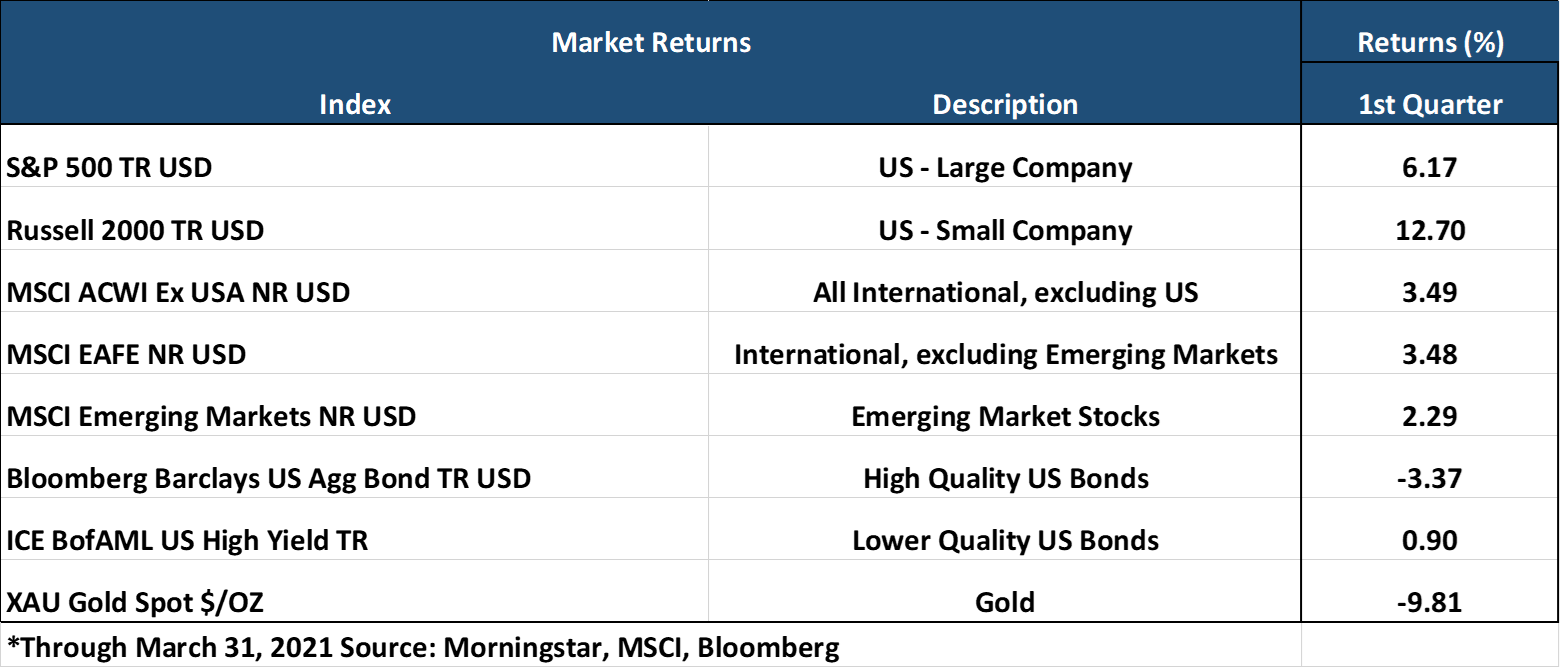
For the 1st quarter, all 35 developed markets and 29 out of 40 developing markets tracked by MSCI delivered positive returns. Additional highlights include:
- In the U.S., small companies handily outperformed large companies, and value stocks continued their recent outperformance of growth stocks, both continuing sharp reversals from long-term trends.
- All 11 S&P 500 sectors delivered positive returns for the 1st quarter, with the Energy and Financial sectors leading the way and continuing their strong performance from the last 3-months of 2020. The energy sector was helped by a nearly 22% gain in crude oil prices in the first quarter.
- Information technology, the standout performer of 2020, delivered the most modest returns of all sectors.
- Positive performance was also found in overseas markets. However, performance was not on par with the U.S. as the U.S. dollar generally increased in value relative to foreign currencies, providing a headwind to international returns.
- Developed market international stocks outperformed emerging markets stocks, which lagged due to losses in the Latin American markets. Among developed markets, Canadian, U.K., and Hong Kong stocks led the way.
Bonds
Overall, the bond markets' movement led to negative returns for the quarter as Treasury bond yields moved sharply higher. The quarterly highlights include:
- The 10-year Treasury bond yield increased 0.82% for the quarter, while the yield curve steepened dramatically from the end of the fourth quarter.
- Treasury Inflation-Protected Securities had negative returns but performed much better than regular Treasury bonds on a relative basis, as investors anticipate higher inflation.
- Non-investment-grade bonds (high yield), which have returns that often correlate with stocks, once again delivered the best returns of any fixed income sector for the first quarter of the year.
- Credit spreads, a measure of the risk of default in the bond market, continued to decline on the more positive economic outlook, providing a relative performance tailwind to asset-backed securities.
- Although down modestly, tax-exempt municipal bonds bested most other investment-grade sectors in Q1.
Important Disclosure Information
This report is provided as information and commentary regarding the market. The views expressed in this report are as of the date of the report, and are subject to change based on market and other conditions. This report contains certain statements that may be deemed forward-looking statements. Please note that any such statements are not guarantees of any future performance and actual results or developments may differ materially from those projected.
Please note that nothing in this report post should be construed as an offer to sell or the solicitation of an offer to purchase an interest in any security or separate account. Nothing is intended to be, and you should not consider anything to be, investment, accounting, tax or legal advice. If you would like investment, accounting, tax or legal advice, you should consult with your own financial advisors, accountants, or attorneys regarding your individual circumstances and needs. Advice may only be provided by AtwoB after entering into an investment advisory or financial planning agreement. Moreover, you should not assume that any discussion or information contained in this newsletter serves as the receipt of, or as a substitute for, personalized investment and/or planning advice from AtwoB. If you are an AtwoB client, please remember to contact AtwoB, in writing, if there are any changes in your personal/financial situation or investment objectives for the purpose of reviewing/evaluating/revising our previous recommendations and/or services.
Past performance is not a guarantee of future returns. Investing involves risk and possible loss of principal capital. Different types of investments involve varying degrees of risk, and there can be no assurance that the future performance of any specific investment, investment strategy, or product (including the investments and/or investment strategies recommended or undertaken by AtwoB, or any non-investment related content, made reference to directly or indirectly in this newsletter will be profitable, equal any corresponding indicated historical performance level(s), be suitable for your portfolio or individual situation, or prove successful. Historical performance results for investment indices and/or categories have been provided for general comparison purposes only, and generally do not reflect the deduction of any fees or expenses, transaction and/or custodial charges, the deduction of an investment management fee, nor the impact of taxes, the incurrence of which would have the effect of decreasing historical performance results. It should not be assumed that your account holdings correspond directly to any comparative indices and/or categories.
AtwoB is neither a law firm nor a certified public accounting firm and no portion of the newsletter content should be construed as legal or accounting advice. A copy of the AtwoB's current written disclosure Brochure discussing our advisory services and fees continues to remain available upon request.
Index and Category Definitions
The S&P 500 Index is a capitalization-weighted index of 500 U.S. stocks. Russell 2000 TR USD is a market cap weighted index The Russell 2000 measuring the performance of approximately 2,000 smallest-cap American companies The MSCI All Country World ex-USA Index is a free float-adjusted market capitalization weighted index that is designed to measure the equity market performance of developed and emerging markets. The MSCI All Country World ex-USA Index consists of 22 developed and 24 emerging market country indices. The MSCI EAFE Index (Europe, Australasia, Far East) is a free float-adjusted market capitalization index that is designed to measure the equity market performance of developed markets, excluding the U.S. & Canada. The MSCI Emerging Markets (E.M.) Index is a free float-adjusted market capitalization index that is designed to measure equity market performance of 24 emerging markets countries. Bloomberg Barclays U.S. Aggregate Bond Index is an index of the U.S. investment-grade fixed-rate bond market, including both government and corporate bonds. ICE BofAML U.S. High Yield Index is an unmanaged index of below-investment grade U.S. corporate bonds. XZU Gold Spot $/Oz reflects the exchange rate of Gold against the U.S. dollar index