
Big Picture and Key Takeaway
2nd Quarter 2021
Key Takeaway
The global stock market continued its steady ascent from the depths of the pandemic in late March of 2020. Bonds rejoined the party as well in the second quarter as interest rates declined after a sharp increase in the first three months of the year. With interest rates lower, COVID infection rates dropping precipitously, and the global economic recovery continuing apace, financial markets moved higher with little volatility. Both fiscal and monetary policy remain supportive, but their impact may wane as Congress debates further spending and the Fed grapples with how to handle “emergency” monetary policy in the face of robust growth and inflation. Inflation will be a focus in the months to come to determine if current high levels are “transitory”, as the Fed believes, or something more persistent. The latter scenario would be disruptive as a more persistent inflationary regime is not likely priced into policy forecasts or market valuations.
The Big Picture
- Global equity markets continued their climb from the first quarter, with the U.S. markets once again reaching new highs. While the direction of the overall stock market remained the same, the performance within the market shifted back in favor of growth/stay-at-home stocks versus more cyclical value stocks. In contrast to the first three months of 2021, interest rates declined in the second quarter as inflation expectations stabilized, leading to gains in high-quality bonds.
- Economically, the news was quite positive, highlighted by a robust June nonfarm payroll report, which reflected an increase of 850,000 jobs. The number was well above forecast and reflected a sharp bounce in the hard-hit leisure and hospitality sector. In addition, more positive news came from the real estate market, where the median existing-home price for all housing types in May hit a record high of $350,300, up 23.6% from May 2020 ($283,500), with every region registering a price increase.
- Inflation has become a primary topic of conversation on Wall Street. The core-PCE Price Index (measures prices for goods and services, ex food and energy) for May rose 0.5% over the past month, putting it on a year-over-year pace of 3.4%. The vital question for investors is whether the recent inflation in the economy is more persistent, or rather is "transitory," as the Federal Reserve believes.
- As expected, at the June meeting, the Federal Open Market Committee unanimously decided to keep interest rates near zero for the time being. However, as the U.S. economic recovery progresses and inflation is picking up, it did move up its timeline for possible rate hikes, with 13 of the 18 committee members expecting at least one rate hike by the end of 2023 – a slightly hawkish turn for the Fed. It appears likely that the Fed may begin to taper its asset purchases, possibly as soon as the 4th quarter of 2021. All eyes will be on the Fed's annual meeting in Jackson Hole in August for further clues on the direction of monetary policy.
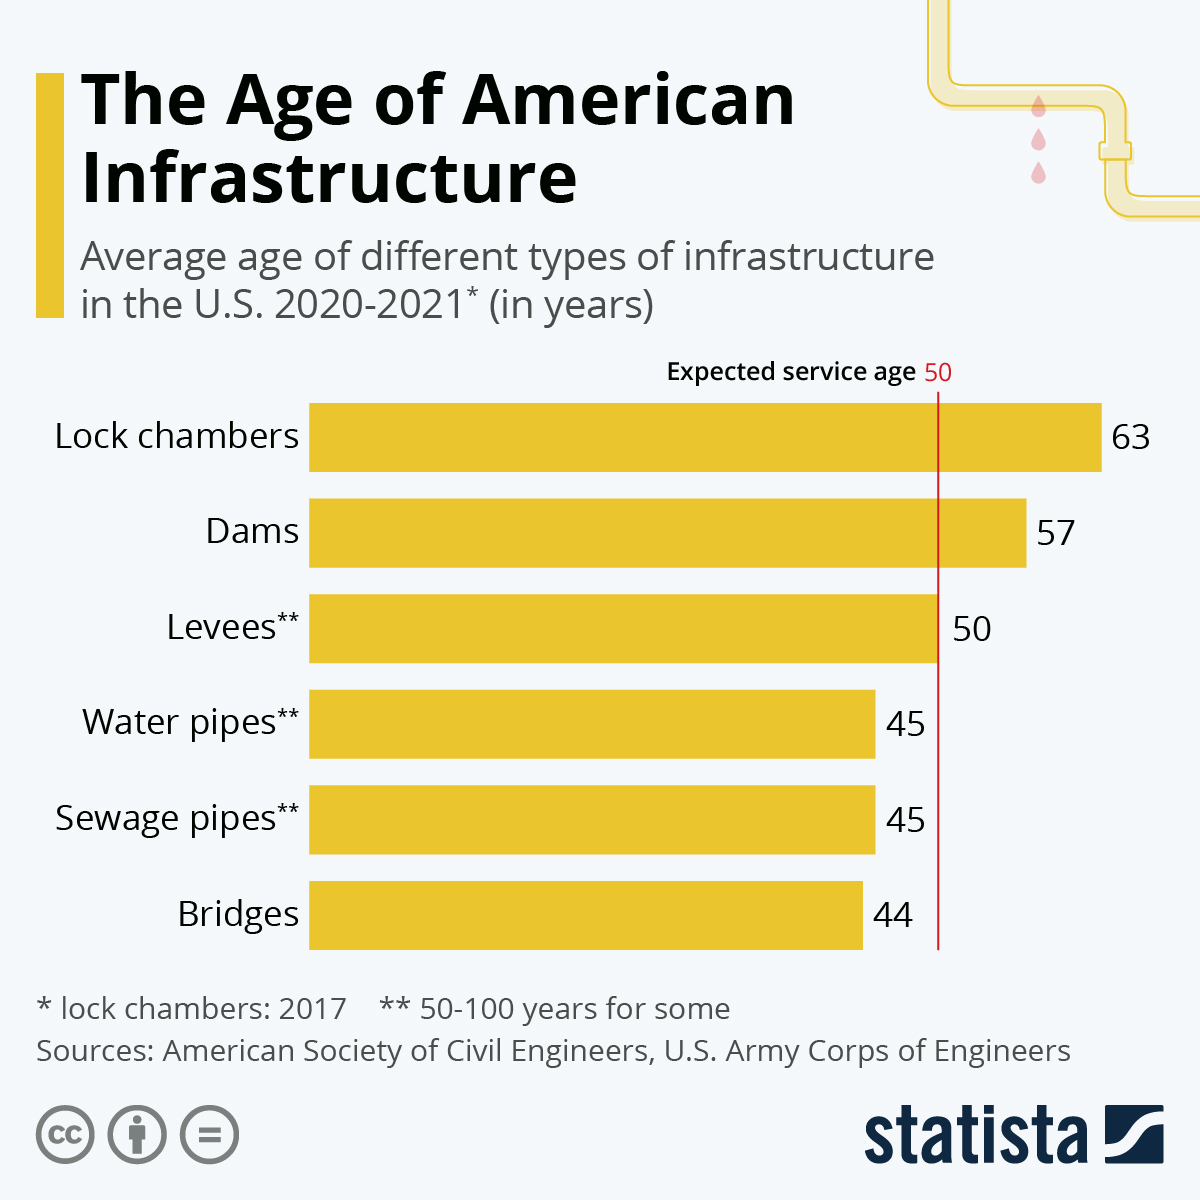
- American physical infrastructure has been famously crumbling for years, but a new coordinated effort to save aging bridges, dams, or levees is likely underway. President Joe Biden announced that a bipartisan group of senators had reached a consensus on a slimmed-down infrastructure bill, which would – once passed – allocate $579 billion in infrastructure spending. The infrastructure bill was "de-linked" from a more ambitious effort to include additional funding for childcare, Medicare, and affordable housing.
Market Performance
Global Stocks
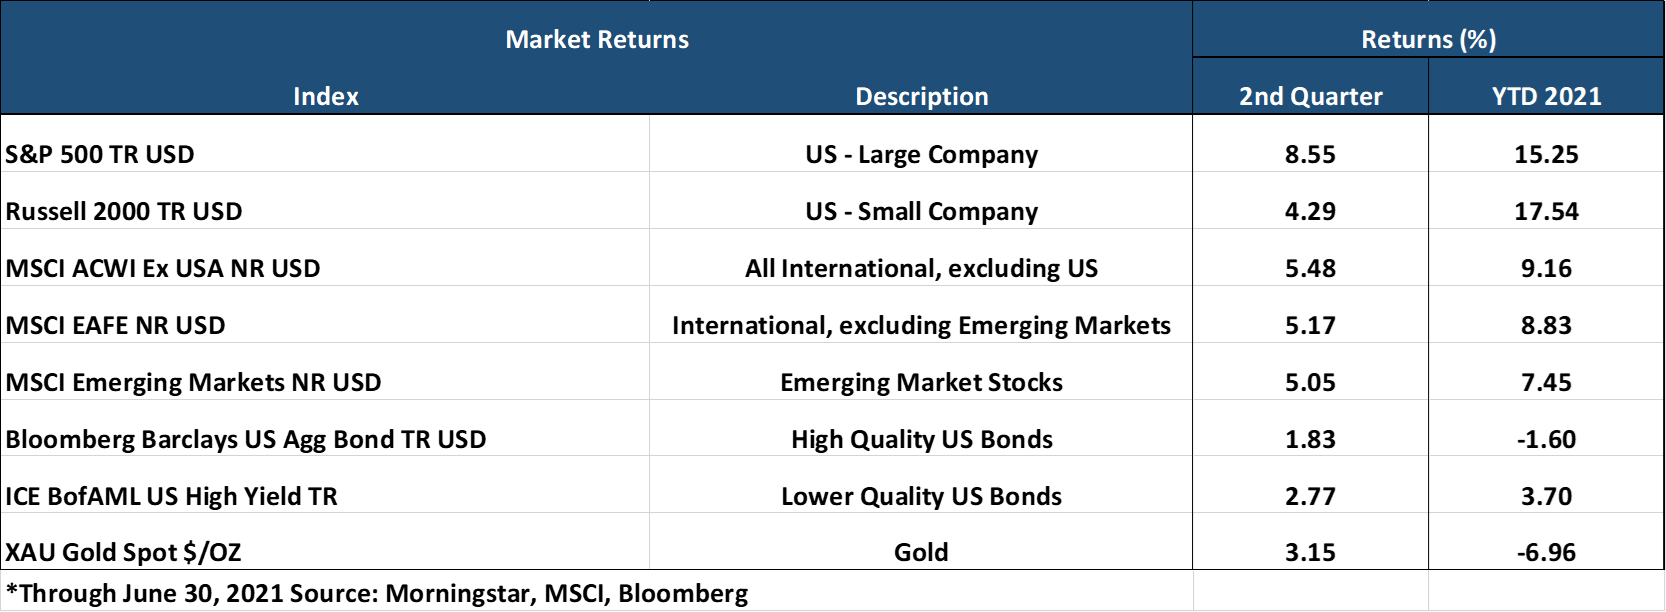
For the 2nd quarter, 34 of 35 developed markets and 34 out of 40 developing markets tracked by MSCI delivered positive returns. Additional highlights include:
- In the U.S., large companies handily outperformed small companies, and growth stocks outperformed value stocks.
- 10 out of 11 S&P 500 sectors delivered positive returns for the 2nd quarter, with the Real Estate and Technology sectors leading. The energy sector continued to perform well was helped by a continued increase in crude oil and natural gas prices in the second quarter. The more defensive utility sector delivered the only negative return among sectors for the quarter.
- Positive performance was also found in overseas markets. However, performance was not on par with the U.S. even though the U.S. dollar generally declined in value relative to foreign currencies, which generally helps international returns.
- Developed market international stocks outperformed emerging markets stocks, which lagged due to losses in the Latin American markets and flat performance from China.
Bonds
Overall, the bond markets' movement led to positive returns for the quarter as Treasury bond yields moved lower. The quarterly highlights include:
- The 10-year Treasury bond yield declined 0.29% for the quarter, while the yield curve flattened noticeably from the end of the first quarter.
- Treasury Inflation-Protected Securities had positive returns as investors anticipate higher inflation with expected inflation rates near 10-year highs.
- Non-investment-grade bonds (high yield), which have returns that often correlate with stocks, delivered positive returns once again as they continue their strong performance run over the past 15 months.
- Credit spreads, a measure of the risk of default in the bond market, continued to decline on the more positive economic outlook, providing a relative performance tailwind to corporate and asset-backed securities.
- Tax-exempt municipal bonds benefitted from the decline in high-quality bond yields with positive performance.
Important Disclosure Information
This report is provided as information and commentary regarding the market. The views expressed in this report are as of the date of the report, and are subject to change based on market and other conditions. This report contains certain statements that may be deemed forward-looking statements. Please note that any such statements are not guarantees of any future performance and actual results or developments may differ materially from those projected.
Please note that nothing in this report post should be construed as an offer to sell or the solicitation of an offer to purchase an interest in any security or separate account. Nothing is intended to be, and you should not consider anything to be, investment, accounting, tax or legal advice. If you would like investment, accounting, tax or legal advice, you should consult with your own financial advisors, accountants, or attorneys regarding your individual circumstances and needs. Advice may only be provided by AtwoB after entering into an investment advisory or financial planning agreement. Moreover, you should not assume that any discussion or information contained in this newsletter serves as the receipt of, or as a substitute for, personalized investment and/or planning advice from AtwoB. If you are an AtwoB client, please remember to contact AtwoB, in writing, if there are any changes in your personal/financial situation or investment objectives for the purpose of reviewing/evaluating/revising our previous recommendations and/or services.
Past performance is not a guarantee of future returns. Investing involves risk and possible loss of principal capital. Different types of investments involve varying degrees of risk, and there can be no assurance that the future performance of any specific investment, investment strategy, or product (including the investments and/or investment strategies recommended or undertaken by AtwoB, or any non-investment related content, made reference to directly or indirectly in this newsletter will be profitable, equal any corresponding indicated historical performance level(s), be suitable for your portfolio or individual situation, or prove successful. Historical performance results for investment indices and/or categories have been provided for general comparison purposes only, and generally do not reflect the deduction of any fees or expenses, transaction and/or custodial charges, the deduction of an investment management fee, nor the impact of taxes, the incurrence of which would have the effect of decreasing historical performance results. It should not be assumed that your account holdings correspond directly to any comparative indices and/or categories.
AtwoB is neither a law firm nor a certified public accounting firm and no portion of the newsletter content should be construed as legal or accounting advice. A copy of the AtwoB's current written disclosure Brochure discussing our advisory services and fees continues to remain available upon request.
Index and Category Definitions
The S&P 500 Index is a capitalization-weighted index of 500 U.S. stocks. Russell 2000 TR USD is a market cap weighted index The Russell 2000 measuring the performance of approximately 2,000 smallest-cap American companies The MSCI All Country World ex-USA Index is a free float-adjusted market capitalization weighted index that is designed to measure the equity market performance of developed and emerging markets. The MSCI All Country World ex-USA Index consists of 22 developed and 24 emerging market country indices. The MSCI EAFE Index (Europe, Australasia, Far East) is a free float-adjusted market capitalization index that is designed to measure the equity market performance of developed markets, excluding the U.S. & Canada. The MSCI Emerging Markets (E.M.) Index is a free float-adjusted market capitalization index that is designed to measure equity market performance of 24 emerging markets countries. Bloomberg Barclays U.S. Aggregate Bond Index is an index of the U.S. investment-grade fixed-rate bond market, including both government and corporate bonds. ICE BofAML U.S. High Yield Index is an unmanaged index of below-investment grade U.S. corporate bonds. XZU Gold Spot $/Oz reflects the exchange rate of Gold against the U.S. dollar index