
Big Picture and Key Takeaway
3rd Quarter 2021
Key Takeaway
The stock market started the quarter on positive footing, but lost momentum in September, reversing a string of positive monthly numbers since the beginning of the year. The themes that helped drive the September swoon were worries of rising inflation and interest rates; the Federal Reserve’s schedule of remaining accommodative; the delta variant; and supply chain issues. Add to that concerns about China’s Evergrande Group risking default on its debt and you had the recipe for a long overdue and modest market pullback. Looking ahead, markets must grapple with the Fed indicating it would look to reduce its asset purchase program while signaling potential interest rate increases later next year. The concern for markets is that the nature of today’s emerging inflation may increase the risk of a policy error. Might too much stimulus for too long lead to higher inflation or will tightening policy too soon short-circuit the recovery? Both results are likely to lead to more volatility ahead.
The Big Picture
- Global equity markets produced mixed results in the third quarter, with markets digesting a number of factors such as increasing interest rates, the fragile Chinese property sector, and the delta variant all posed problems for the economic recovery. Given the pressures that surfaced over the past three months, growth stocks outperformed more cyclical value stocks. Interest rates increased significantly in September as inflationary pressures remained stubborn while the Fed indicated that it would like to wind down its bond purchase program by mid-2022.
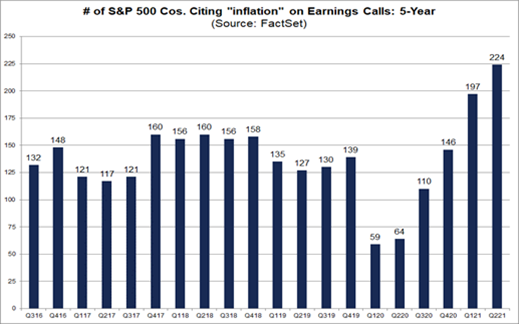
- Inflation and supply chain issues remain a primary focus on Wall Street. The Bureau of Labor Statistics reported in August that over the last 12 months, the Consumer Price Index (CPI) All-Items index increased 5.3%. Other alternative measures of inflation (Cleveland Fed's Trimmed-Mean CPI and Atlanta Fed's Sticky Price CPI) also show underlying inflation running well ahead of the Fed's 2% long-term target. As if we need another reminder about inflation, the number of companies warning of inflation on their latest earnings calls hit an all-time high.
- At the September meeting, the Federal Open Market Committee kept interest rates unchanged and continued its pace of asset purchases of buying bonds to keep interest rates down. However, FOMC Chair Jerome Powell did indicate that "if progress continues, a moderation in the pace of asset purchases can be warranted" and "a gradual tapering process that concludes around the middle of next year may be appropriate." Thus, while acknowledging elevated inflation due to supply bottlenecks has been more significant and longer-lasting than expected," the Fed seems unfazed as long-term inflation expectations remain around 2%.
- On the last day of September, with just hours to spare, President Biden signed a bill extending government funding through December 3rd to averti a partial shutdown, an exercise which seems to occur with regularity. There is now the matter of the hotly debated infrastructure, social policy, and climate bills that could carry price tags of at least $1 trillion and up to $3.5 trillion, depending on how the progressive and moderate factions of the Democratic party compromise on a path forward. The way ahead will likely depend on reducing the cost of the proposals by either eliminating proposed programs or shortening their duration.
Market Performance
Global Stocks
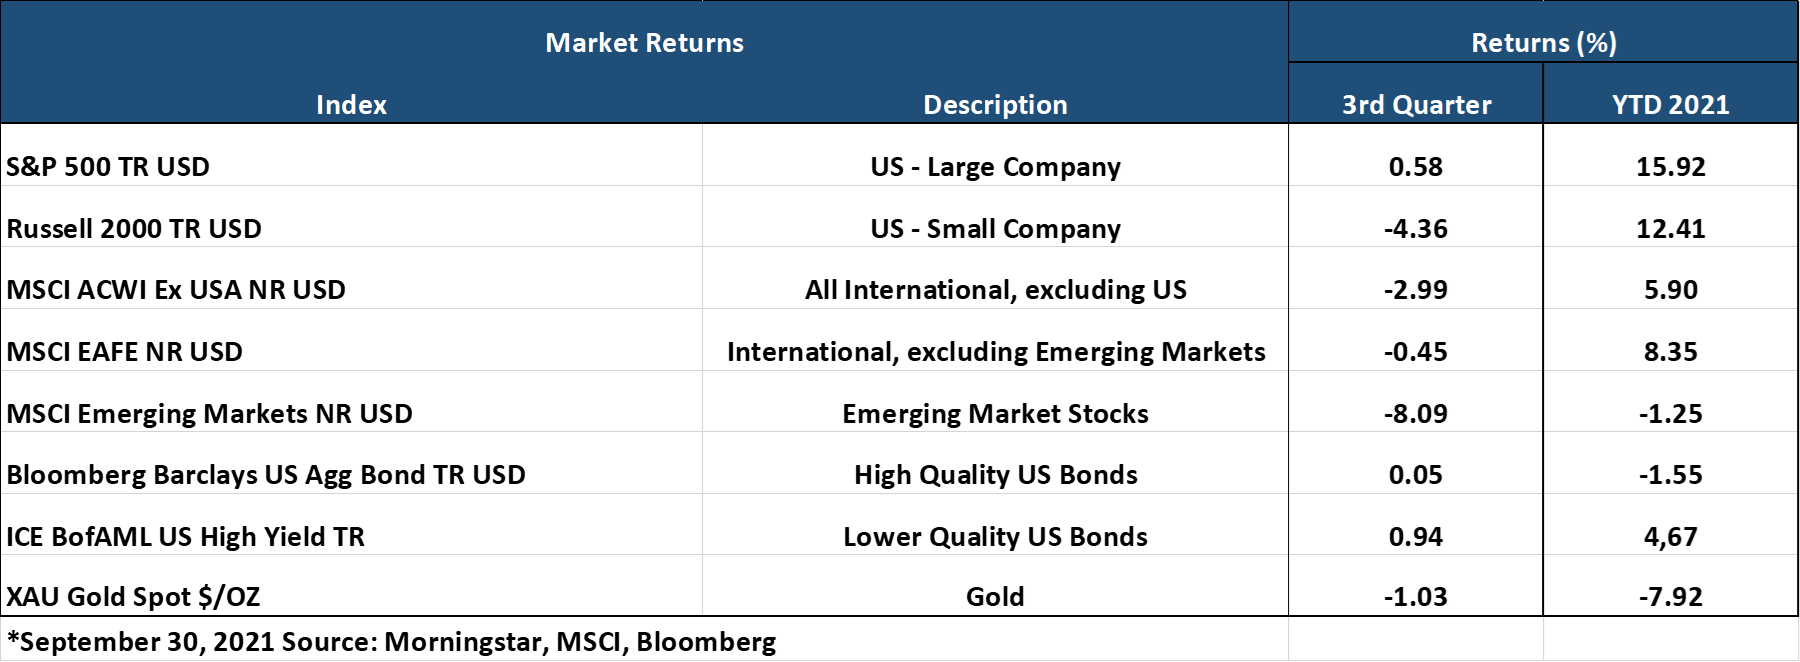
For the 3rd quarter, 32 of 35 developed markets and 26 out of 40 developing markets tracked by MSCI delivered negative returns. Despite a mixed 3rd quarter, year-to-date returns remain in solid positive territory in the U.S. and developed international markets. Additional highlights include:
- In the U.S., large companies handily outperformed small companies, and growth stocks outperformed value stocks.
- While the S&P 500 eked out a small positive gain overall, 6 out of 11 S&P 500 sectors delivered negative returns for the 3rd quarter, with the Industrials and Materials performing the worst.
- Financials, Communications Services, and Tech produced the best returns of all sectors, albeit modest.
- Developed market international stocks handily outperformed emerging markets stocks, which lagged due to dismal performance from China as the government cracked down on tech companies, problems in the property sector, and the impact by a substantial rise in the value of the U.S. dollar relative to many foreign currencies.
Bonds
Overall, the bond markets' movement led to slight positive returns for the quarter as Treasury bond yields moved modestly higher. The quarterly highlights include:
- The 10-year Treasury bond yield increased 0.08% for the quarter, while the yield curve steepened from the end of the second quarter.
- Treasury Inflation-Protected Securities delivered the best returns of any sector and performed much better than regular Treasury bonds on a relative basis, as investors continue to anticipate higher inflation.
- Non-investment-grade bonds (high yield), which have returns that often correlate with stocks, again delivered positive performance for the quarter.
- Credit spreads, a measure of the risk of default in the bond market, increased modestly for the quarter as investors demanded slightly more compensation for assuming credit risk.
- Municipal bonds had the worst return among investment-grade sectors in Q3 as default rates increased.
Important Disclosure Information
This report is provided as information and commentary regarding the market. The views expressed in this report are as of the date of the report, and are subject to change based on market and other conditions. This report contains certain statements that may be deemed forward-looking statements. Please note that any such statements are not guarantees of any future performance and actual results or developments may differ materially from those projected.
Please note that nothing in this report post should be construed as an offer to sell or the solicitation of an offer to purchase an interest in any security or separate account. Nothing is intended to be, and you should not consider anything to be, investment, accounting, tax or legal advice. If you would like investment, accounting, tax or legal advice, you should consult with your own financial advisors, accountants, or attorneys regarding your individual circumstances and needs. Advice may only be provided by AtwoB after entering into an investment advisory or financial planning agreement. Moreover, you should not assume that any discussion or information contained in this newsletter serves as the receipt of, or as a substitute for, personalized investment and/or planning advice from AtwoB. If you are an AtwoB client, please remember to contact AtwoB, in writing, if there are any changes in your personal/financial situation or investment objectives for the purpose of reviewing/evaluating/revising our previous recommendations and/or services.
Past performance is not a guarantee of future returns. Investing involves risk and possible loss of principal capital. Different types of investments involve varying degrees of risk, and there can be no assurance that the future performance of any specific investment, investment strategy, or product (including the investments and/or investment strategies recommended or undertaken by AtwoB, or any non-investment related content, made reference to directly or indirectly in this newsletter will be profitable, equal any corresponding indicated historical performance level(s), be suitable for your portfolio or individual situation, or prove successful. Historical performance results for investment indices and/or categories have been provided for general comparison purposes only, and generally do not reflect the deduction of any fees or expenses, transaction and/or custodial charges, the deduction of an investment management fee, nor the impact of taxes, the incurrence of which would have the effect of decreasing historical performance results. It should not be assumed that your account holdings correspond directly to any comparative indices and/or categories.
AtwoB is neither a law firm nor a certified public accounting firm and no portion of the newsletter content should be construed as legal or accounting advice. A copy of the AtwoB's current written disclosure Brochure discussing our advisory services and fees continues to remain available upon request.
Index and Category Definitions
The S&P 500 Index is a capitalization-weighted index of 500 U.S. stocks. Russell 2000 TR USD is a market cap weighted index The Russell 2000 measuring the performance of approximately 2,000 smallest-cap American companies The MSCI All Country World ex-USA Index is a free float-adjusted market capitalization weighted index that is designed to measure the equity market performance of developed and emerging markets. The MSCI All Country World ex-USA Index consists of 22 developed and 24 emerging market country indices. The MSCI EAFE Index (Europe, Australasia, Far East) is a free float-adjusted market capitalization index that is designed to measure the equity market performance of developed markets, excluding the U.S. & Canada. The MSCI Emerging Markets (E.M.) Index is a free float-adjusted market capitalization index that is designed to measure equity market performance of 24 emerging markets countries. Bloomberg Barclays U.S. Aggregate Bond Index is an index of the U.S. investment-grade fixed-rate bond market, including both government and corporate bonds. ICE BofAML U.S. High Yield Index is an unmanaged index of below-investment grade U.S. corporate bonds. XZU Gold Spot $/Oz reflects the exchange rate of Gold against the U.S. dollar index