
Big Picture and Key Takeaway
4th Quarter 2020
Key Takeaway
Global stock and bond markets continued their astounding rebound in the 4th quarter, with the global stock market finishing the year with a double-digit gain for 2020. The ascension of the stock market from the lows in late-March was impressive in both its speed and magnitude in the face of a COVID-induced economic recession and significant political uncertainty. The economic and political risks were simply overwhelmed by the massive coordination of both fiscal and monetary policy across the globe throughout an unforgettable 2020. In 2021, will more stimulus be delivered? Probably. Will vaccinations set up a successful broad-based economic recovery? Hopefully. Are these outcomes already embedded in record high stock prices and record low bond yields? That is the answer investors will likely be contemplating most in the year ahead.
The Big Picture
Investors were thankful that the two dominating news events of 2020 ended, as the outcome of the presidential election and more certainty concerning a COVID-19 vaccine came into focus. Global equity markets pulled back in October, turned in excellent returns in November, performed admirably for the month of December, and closed out the fourth quarter of 2020 with new record highs.
Nevertheless, there was a lot of economic data that painted a conflicting picture. On the positive side:
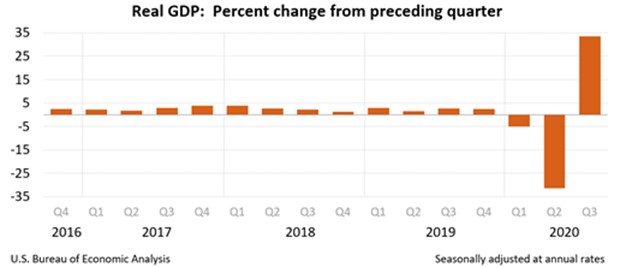
- The U.S. Department of Commerce released the "third" estimate of real gross domestic product for the third quarter, which was revised upwards from 33.1% to 33.4%.
- Real estate continues to be a positive for the economy, as total existing home sales were up almost 26% from a year ago ending in November, and that the median sales price shot up over 14% in the past year.
- In the manufacturing sector, the Institute of Supply Management's manufacturing activity expanded at its fastest pace since 2018.
On the negative side of the economic ledger:
- Employers cut 140,000 jobs in December, which was the first decline in payrolls since April, and losses heavily concentrated in the leisure and hospitality businesses.
- The latest report showed the number of long-term unemployed, those who have been out of work for longer than 6-months sits at nearly 4 million, and almost four times the number before than pandemic began.
- The number of U.S. jobs is still 10 million below where they were before the pandemic started.
In addition to the Fed's extraordinarily accommodative monetary policy and emergency measures, most believed that Congressional action was needed on the fiscal front for the economic outlook to improve. Fortunately, on December 21st, after months of back-and-forth negotiations, Congress passed a $900 billion COVID-relief bill that will provide direct relief to struggling individuals, families, and businesses. With new leadership set to transition in January, most believe that additional stimulus will be delivered as well. From a pure market perspective, the coordination of monetary and fiscal policy on such a massive scale was probably the most critical policy development in 2020 – effectively overwhelming the economic shock brought on by COVID-19.
Market Performance
Global Stocks
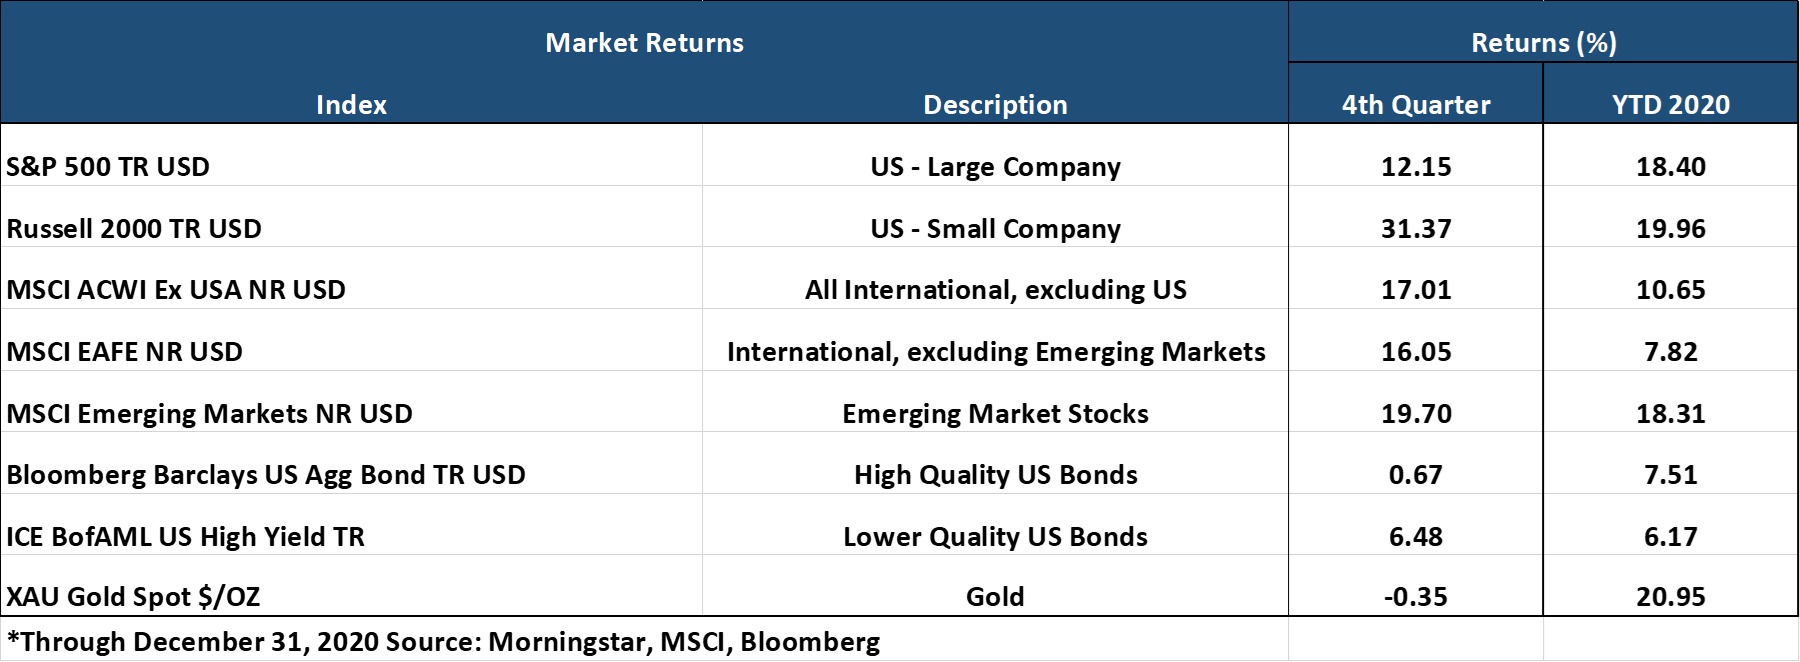
For the 4th quarter, all 35 developed markets and all 40 developing markets tracked by MSCI delivered positive returns. Additional highlights include:
- In the U.S., small companies handily outperformed large companies, and value stocks outperformed growth stocks, representing reversals from long-term trends.
- All 11 S&P 500 sectors delivered positive returns for the 4th quarter, with the beaten-down Energy and Financials sectors leading the way.
- For the full year, the performance difference between the best performing sector (Information Technology) and the worst performing (Energy) was an astounding 77%.
- Strong performance in 2020 was not confined to the U.S., as the Asian Pacific Region and Emerging Markets delivered returns on par with or exceeding the U.S. market.
- While European markets delivered strong positive results in the 4th quarter, Europe lagged the rest of the world significantly for 2020.
Bonds
Overall, the bond markets' movement led to positive gains for the quarter as Treasury bond yields moved higher, while credit spreads moved significantly lower. The quarterly highlights include:
- The 10-year Treasury bond yield increased 0.24% for the quarter, while the yield curve steepened from the end of the third quarter.
- Treasury Inflation-Protected Securities delivered positive performance in Q4, and the best performance among investment-grade fixed income sectors in 2020, as investors anticipate higher inflation.
- Non-investment-grade bonds (high yield) continued their strong recovery, delivering the best returns of any fixed income sector for the final three months of the year.
- Credit spreads, a measure of the risk of default in the bond market, continued their steep declines from the distressed levels in March, providing a significant boost to the corporate and asset-backed fixed income sectors.
- Tax-exempt municipal bonds continued their rebound and bested most other investment-grade sectors in Q4.
Important Disclosure Information
This report is provided as information and commentary regarding the market. The views expressed in this report are as of the date of the report, and are subject to change based on market and other conditions. This report contains certain statements that may be deemed forward-looking statements. Please note that any such statements are not guarantees of any future performance and actual results or developments may differ materially from those projected.
Please note that nothing in this report post should be construed as an offer to sell or the solicitation of an offer to purchase an interest in any security or separate account. Nothing is intended to be, and you should not consider anything to be, investment, accounting, tax or legal advice. If you would like investment, accounting, tax or legal advice, you should consult with your own financial advisors, accountants, or attorneys regarding your individual circumstances and needs. Advice may only be provided by AtwoB after entering into an investment advisory or financial planning agreement. Moreover, you should not assume that any discussion or information contained in this newsletter serves as the receipt of, or as a substitute for, personalized investment and/or planning advice from AtwoB. If you are an AtwoB client, please remember to contact AtwoB, in writing, if there are any changes in your personal/financial situation or investment objectives for the purpose of reviewing/evaluating/revising our previous recommendations and/or services.
Past performance is not a guarantee of future returns. Investing involves risk and possible loss of principal capital. Different types of investments involve varying degrees of risk, and there can be no assurance that the future performance of any specific investment, investment strategy, or product (including the investments and/or investment strategies recommended or undertaken by AtwoB, or any non-investment related content, made reference to directly or indirectly in this newsletter will be profitable, equal any corresponding indicated historical performance level(s), be suitable for your portfolio or individual situation, or prove successful. Historical performance results for investment indices and/or categories have been provided for general comparison purposes only, and generally do not reflect the deduction of any fees or expenses, transaction and/or custodial charges, the deduction of an investment management fee, nor the impact of taxes, the incurrence of which would have the effect of decreasing historical performance results. It should not be assumed that your account holdings correspond directly to any comparative indices and/or categories.
AtwoB is neither a law firm nor a certified public accounting firm and no portion of the newsletter content should be construed as legal or accounting advice. A copy of the AtwoB's current written disclosure Brochure discussing our advisory services and fees continues to remain available upon request.
Index and Category Definitions
The S&P 500 Index is a capitalization-weighted index of 500 U.S. stocks. Russell 2000 TR USD is a market cap weighted index The Russell 2000 measuring the performance of approximately 2,000 smallest-cap American companies The MSCI All Country World ex-USA Index is a free float-adjusted market capitalization weighted index that is designed to measure the equity market performance of developed and emerging markets. The MSCI All Country World ex-USA Index consists of 22 developed and 24 emerging market country indices. The MSCI EAFE Index (Europe, Australasia, Far East) is a free float-adjusted market capitalization index that is designed to measure the equity market performance of developed markets, excluding the U.S. & Canada. The MSCI Emerging Markets (E.M.) Index is a free float-adjusted market capitalization index that is designed to measure equity market performance of 24 emerging markets countries. Bloomberg Barclays U.S. Aggregate Bond Index is an index of the U.S. investment-grade fixed-rate bond market, including both government and corporate bonds. ICE BofAML U.S. High Yield Index is an unmanaged index of below-investment grade U.S. corporate bonds. XZU Gold Spot $/Oz reflects the exchange rate of Gold against the U.S. dollar index