
F.I.T. Focus - Democrats, Republicans, Elections & Stock Market Returns
September 2020
It is understandable to believe that an election or political party will have an outsized impact on your investments, but historically, the truth is that elections and political parties have much less impact than you may believe. Let's look at some statistics about the stock market from the following perspectives:
- Market Returns Under Republican and Democratic Terms
- Market Returns Under a Divided or Unified Government (Congress)
- Market Returns Before and After Elections
- Market Volatility Before and After Elections
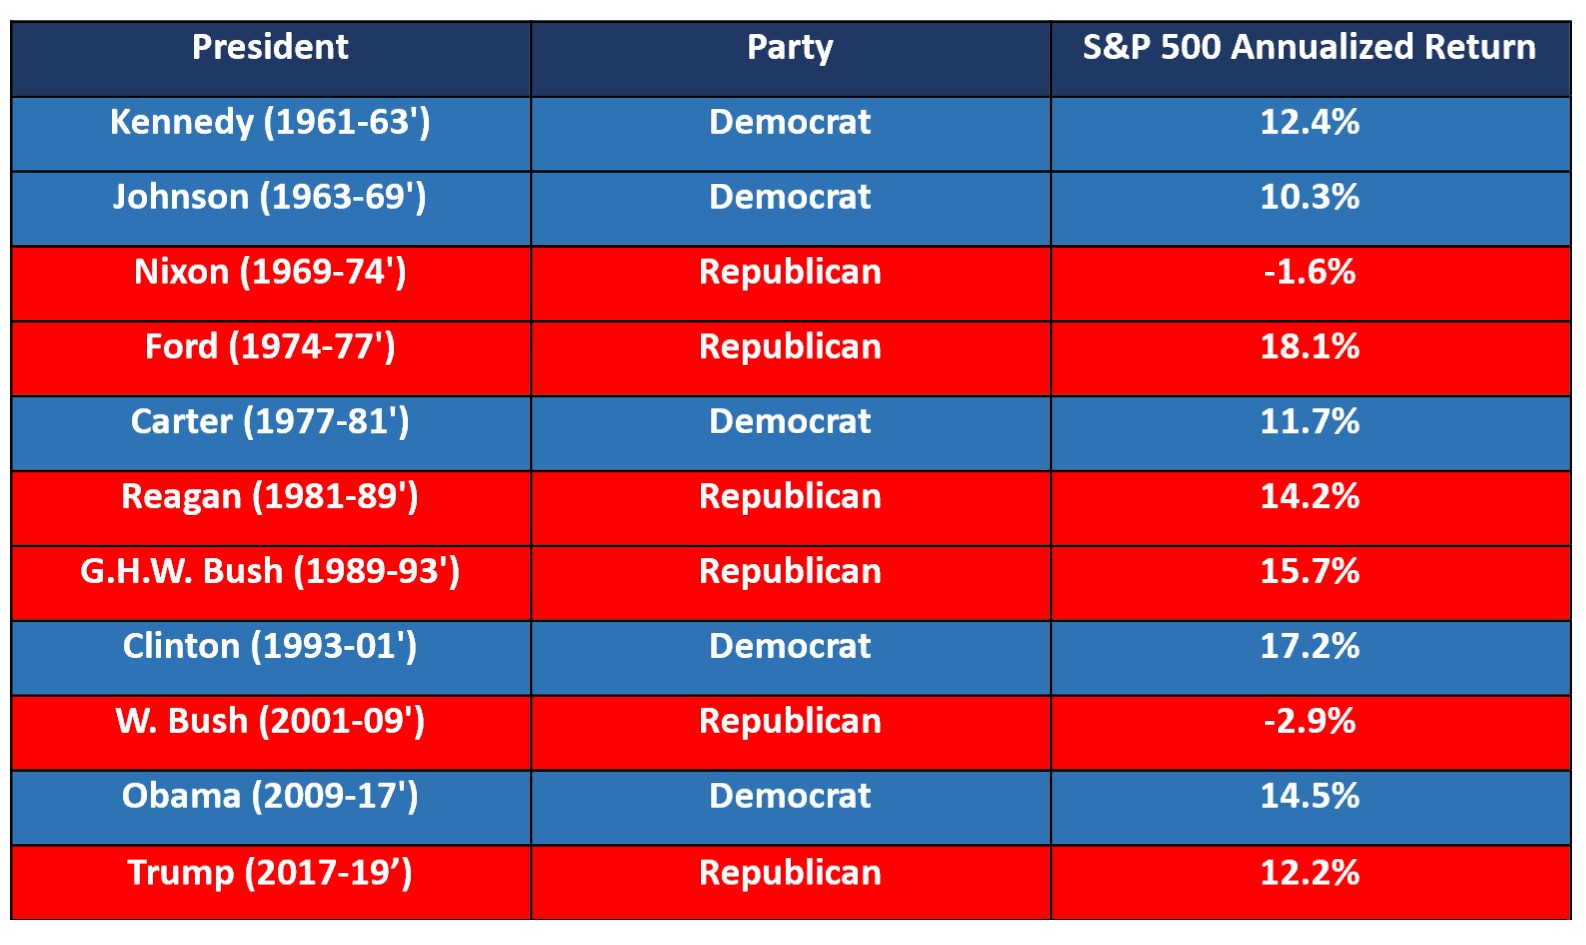
Market Returns Under Republican and Democratic Presidential Terms
Here are the returns for individual presidents going back to the Kennedy Administration in 1961:
 Source: Hartford Funds and Morningstar
While it is tempting to parse the data and glean specific insights about which party is better for the stock market, there isn't much insight to be collected from that exercise. Going back to 1933, the stock market performed better under Democratic Presidents than Republicans, on average. All the advantage, however, is explained by the boom years under Bill Clinton and the subsequent dot-com bust and Global Financial Crisis under George W. Bush. Except for these two presidencies, the difference in returns is practically zero.
Market Returns Under a Divided or Unified Government (Congress)
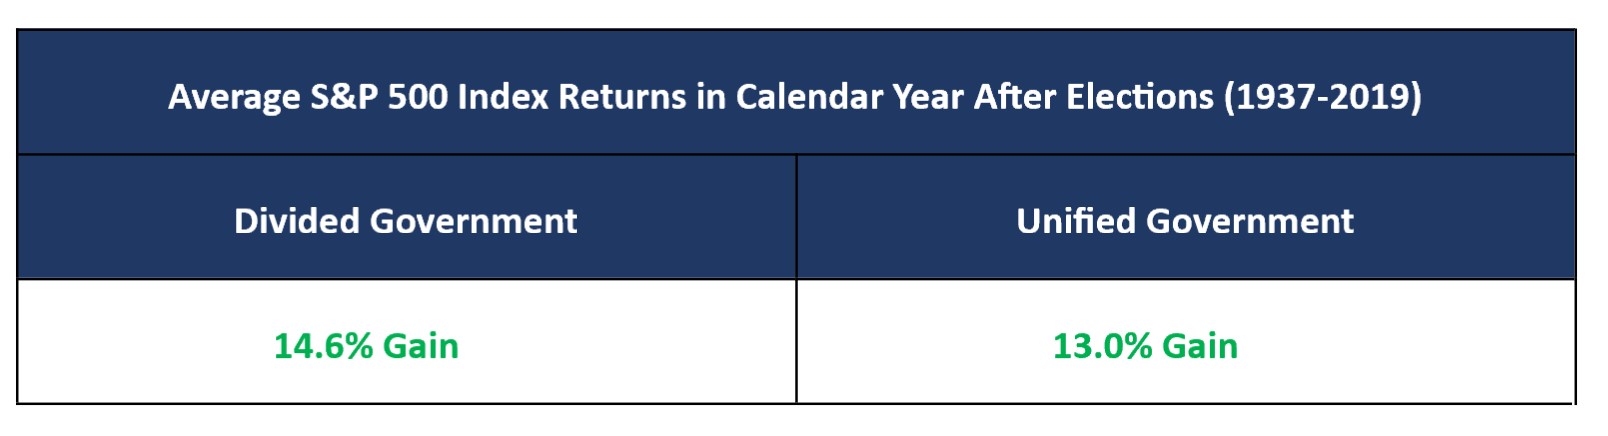
The Executive Branch is just one branch of the government, so the President may be dealing with a unified government (where the same party represents Congress as the President) or a divided government (where the opposite party of the President controls Congress). So how has the stock market performed under divided or unified governments?
 Source: Hartford Funds and Morningstar
Since 1937, in the calendar year following a presidential or mid-term election, the S&P 500 Index has averaged a 12-month return of 14.6% when the election resulted in a divided government (presidential party was different than House and/or Senate) and 13.0% when a unified government.
Market Returns Before and After Elections
But what about returns just before and after elections?
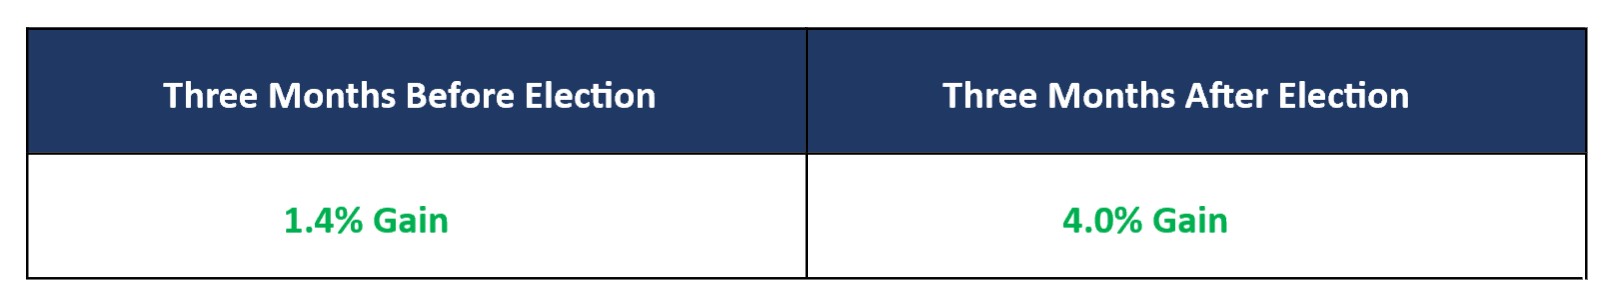
Over the last 12 election cycles going back to 1972, the average returns of the S&P 500 before and after election day have been:
 Source: Hartford Funds and Morningstar
There are some exceptions to these gains, namely the market crash during the 2008 Global Financial Crisis, which accompanied the Obama/McCain election in 2008. Additionally, in 2000, the market sold off by 4.1% from Election Day until December 12, when the Supreme Court handed down it's ruling in the contested election between George W. Bush and Al Gore. However, it has generally not been fruitful to make large changes to your strategy before or after a Presidential election.
Market Volatility Before and After Elections
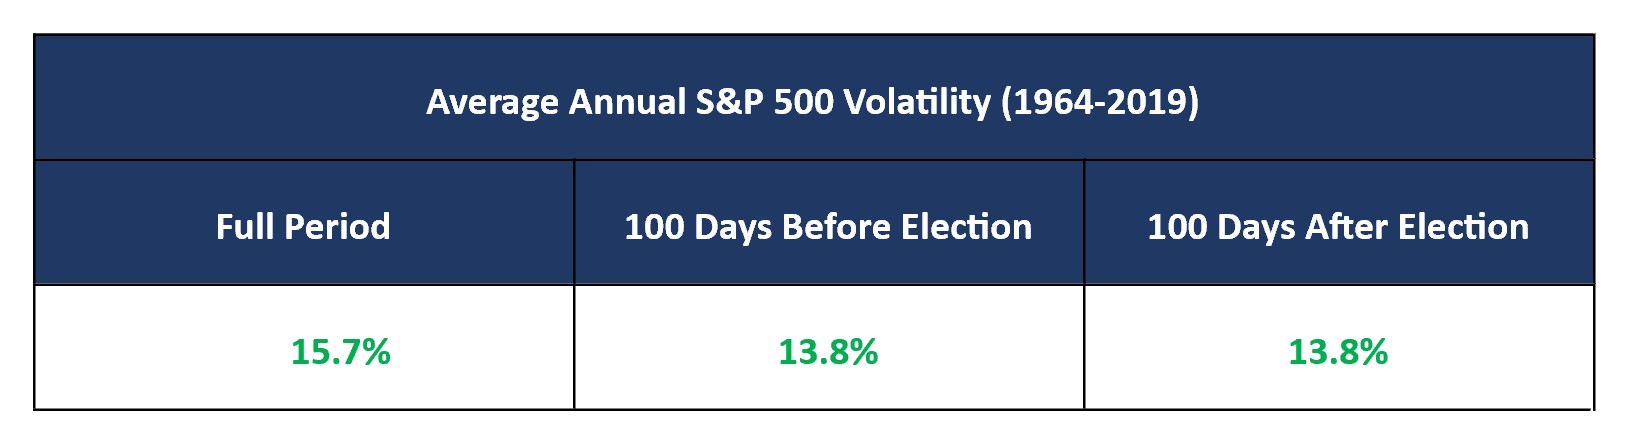
Assuredly, markets must be more volatile, leading up to or right after elections, correct? Wrong. According to Vanguard:
 Source: Vanguard and Thomson Reuters
"From January 1, 1964, to December 31, 2019, the Standard & Poor's 500 Index's annualized volatility was 13.8% in the 100 days both before and after a presidential election, which was lower than the 15.7% annualized volatility for the full time period."
What Does This All Mean?
Factors such as pandemics, market cycles, interest rates, inflation, Federal Reserve programs, trade, economic outlooks, changes in policies, and wars, may have more impact on market returns than the outcome of elections. When it comes to politics, history dictates that markets chart their own course. When it comes to your investments, sticking to your plan and staying invested is the most prudent path forward, no matter which party is in office, who controls Congress, or whether an election is on the horizon.
If you have any questions regarding this report, please contact us at info@atwob.com or 914.302.3233
Point B Planning, LLC d/b/a AtwoB | 23 Parkway, 2nd Floor Katonah, NY 10536 | www.atwob.com
Important Disclosure Information
Important Risks: Investing involves risk, including the possible loss of principal. Diversification does not ensure a profit or protect against a loss in a declining market. Past performance is not a guarantee of future results. Indices are unmanaged and not available for direct investment.
This information should not be considered investment advice or a recommendation to buy/sell any security. In addition, it does not take into account the specific investment objectives, tax, and financial condition of any specific person. This information has been prepared from sources believed reliable but the accuracy and completeness of the information cannot be guaranteed.
This material and/or its contents are current at the time of writing and are subject to change without notice. This material may not be copied, photocopied or duplicated in any form or distributed in whole or in part, for any purpose, without the express written consent of Hartford Funds Distributors, LLC.
The views expressed in this report are as of the date of the report, and are subject to change based on market and other conditions. This report contains certain statements that may be deemed forward-looking statements. Please note that any such statements are not guarantees of any future performance and actual results or developments may differ materially from those projected.
Past performance is not a guarantee of future returns. Investing involves risk and possible loss of principal capital. Different types of investments involve varying degrees of risk, and there can be no assurance that the future performance of any specific investment, investment strategy, or product (including the investments and/or investment strategies recommended or undertaken by AtwoB, or any non-investment related content, made reference to directly or indirectly in this newsletter will be profitable, equal any corresponding indicated historical performance level(s), be suitable for your portfolio or individual situation, or prove successful. Historical performance results for investment indices and/or categories have been provided for general comparison purposes only, and generally do not reflect the deduction of any fees or expenses, transaction and/or custodial charges, the deduction of an investment management fee, nor the impact of taxes, the incurrence of which would have the effect of decreasing historical performance results. It should not be assumed that your account holdings correspond directly to any comparative indices and/or categories.
Please note that nothing in this report post should be construed as an offer to sell or the solicitation of an offer to purchase an interest in any security or separate account. Nothing is intended to be, and you should not consider anything to be, investment, accounting, tax or legal advice. If you would like investment, accounting, tax or legal advice, you should consult with your own financial advisors, accountants, or attorneys regarding your individual circumstances and needs. Advice may only be provided by AtwoB after entering into an advisory agreement. Moreover, you should not assume that any discussion or information contained in this newsletter serves as the receipt of, or as a substitute for, personalized investment advice from AtwoB. If you are an AtwoB client, please remember to contact AtwoB, in writing, if there are any changes in your personal/financial situation or investment objectives for the purpose of reviewing/evaluating/revising our previous recommendations and/or services. AtwoB is neither a law firm nor a certified public accounting firm and no portion of the newsletter content should be construed as legal or accounting advice. A copy of the AtwoB’s current written disclosure Brochure discussing our advisory services and fees continues to remain available upon request.