
March 2019 Big Picture and Key Takeaway
The Big Picture - March “Gladness” – Fed Rate Expectations Help Drive Markets Higher
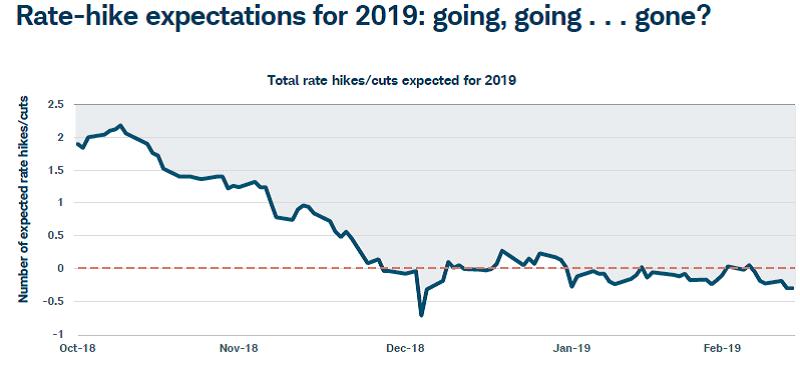

There were several positive developments during the quarter for markets, such as positive corporate earnings growth, but the one that seemed to dominate headlines was the Federal Reserve's change concerning rate hikes. The Fed’s change in its monetary policy stance over the past few months has been quite remarkable. The table above represents the market's expectations for the number of rate hikes the Fed will introduce in 2019. Continued interest rate increases through 2019 were being forecasted by the Fed and the markets as late as the Fall, but that quickly changed after the swift global stock market declines in December. Now, the Fed is signaling that it will take a wait and see approach and is no longer expected to raise interest rates this year.
While markets like the shift by the Fed, some evidence may indicate the economy is slowing down, and especially as it relates to housing. The Commerce Department released data showing a nearly 9% drop in housing starts in February and year–over–year changes in housing price gains fell to its lowest level since 2011. More broadly, personal income and spending missed expectations and the Commerce Department slightly lowered its estimate of fourth-quarter Gross Domestic Product growth. First quarter growth is projecting to 2.3% at a seasonally adjusted annual rate, according to the Atlanta Fed’s GDPNow reading. Global economic growth expectations have generally slowed as well.
Key issues on the table in April will include the status of “Brexit” negotiations within the U.K. and Europe and the trade talks between the US and China. Either of those factors is capable of producing upside and downside surprises for markets depending on their resolution. As of right now, markets are generally optimistic on their potential impact as evidenced by the excellent first three months of 2019.
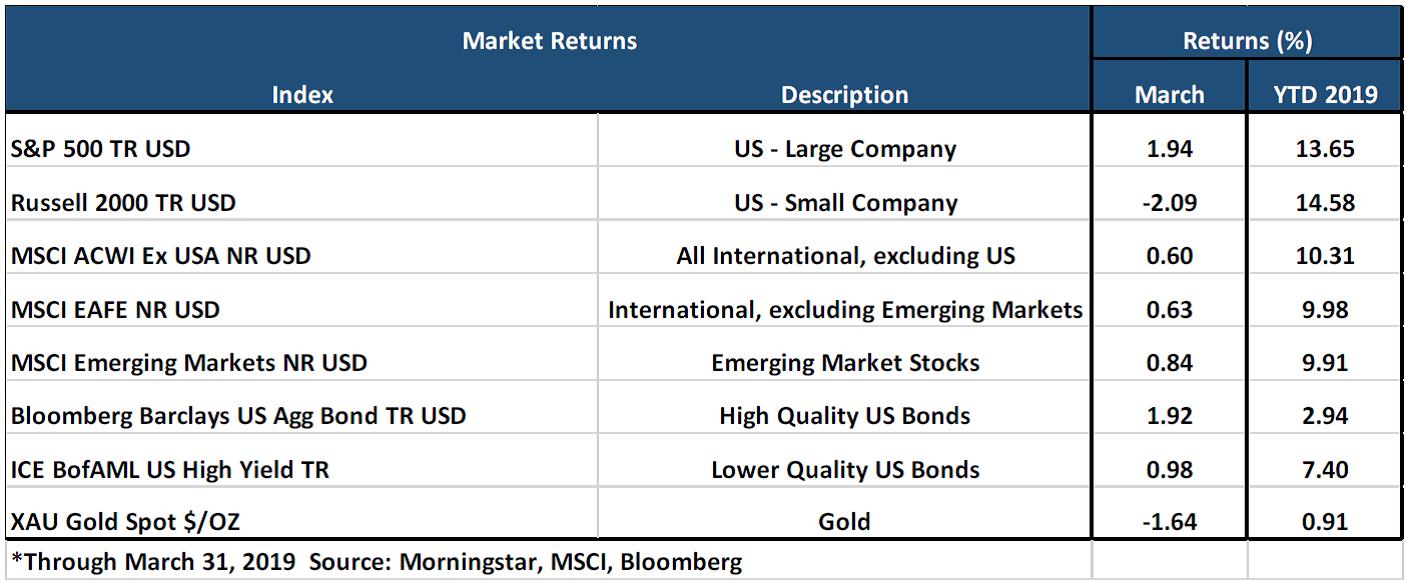
March & YTD Market Performance
Global Stocks
After a tough end to 2018 for global stocks, the first quarter of 2019 started with a bang, as the S&P 500 delivered its best quarter since 2009 with a quarterly gain of 13.7%. The smaller-cap Russell 2000 produced quarterly gains of 14.6%. Gains were broad, with all 11 S&P 500 sectors ending higher for the quarter for the first time since 2014. Technology shares extended a streak of gains that have made them the strongest-performing sector in the S&P 500 this year, with a return of approximately 19.6%. Another standout in the first quarter was energy stocks, up 16.5%. Lastly due to declining interest rates and better financing conditions, Real Estate Investment Trusts increased by 16.4%. International Stocks also gained as the MSCI EAFE Index (Developed Markets) and the MSCI Emerging Markets Index, gained 9.98% and 9.92%, respectively.
Bonds
The yield on the benchmark 10-year U.S. Treasury note - considered a key benchmark for global finance because it is used to help set borrowing costs for areas like housing - settled at 2.416% to end the quarter, well below the 2.68% where it ended last year. Yields, which fall as bond prices rise, have retreated around the world in recent weeks. As a result, the Barclays Aggregate US Bond Index increased by 2.94% for the quarter after a solid March. Lower credit quality bonds, often referred to as “High Yield”, also gained significantly for the quarter by increasing 7.4%. Investors will continue to watch the “yield curve” which inverted briefly this quarter with 10-year yields falling below 3-month yields. The 3-month/10-year version is one of the most reliable signals of future recession as that inverted spread has preceded each of the past seven recessions, including the 2007-2009 contraction, according to the Cleveland Fed.
The Key Takeaway
Markets, for both stocks and bonds, reacted positively to the Fed’s policy reversal, although it begs an obvious question about the strength of the US and global economy – “Should we be concerned about the economy if it cannot handle the prospects of rate increases from such low levels?” With bond yields declining, it’s worth considering the “why”. If they are declining because the global economy is faltering, the stock market may have to contend with a more difficult environment after a great start to 2019. If the economy can re-accelerate, stocks may benefit some more while bonds may retreat. One of these markets is likely wrong about the future. We suspect we’ll know which one soon. In our experience, the bond market tends to be more prescient in these situations where there is a “disconnect” in the outlook between stocks and bonds. That said, the more extreme nature of monetary policy after the financial crisis has led many to believe that certain reliable signals, like the inversion of the yield curve as a harbinger of recession, are less dependable in the current environment. We are always skeptical of “this time is different”, but hopefully it is. If it’s not, a recession would be on the horizon, with potentially negative implications for global stocks.
If you have any questions regarding this report, please contact us at info@today2b.com or 914.302.3233
Point B Planning, LLC d/b/a AtwoB | 23 Parkway, 2nd Floor Katonah, NY 10536 | www.today2b.com
Important Disclosure Information
This report is provided as information and commentary regarding the market. The views expressed in this report are as of the date of the report, and are subject to change based on market and other conditions. This report contains certain statements that may be deemed forward-looking statements. Please note that any such statements are not guarantees of any future performance and actual results or developments may differ materially from those projected.
Past performance is not a guarantee of future returns. Investing involves risk and possible loss of principal capital. Different types of investments involve varying degrees of risk, and there can be no assurance that the future performance of any specific investment, investment strategy, or product (including the investments and/or investment strategies recommended or undertaken by AtwoB, or any non-investment related content, made reference to directly or indirectly in this newsletter will be profitable, equal any corresponding indicated historical performance level(s), be suitable for your portfolio or individual situation, or prove successful. Historical performance results for investment indices and/or categories have been provided for general comparison purposes only, and generally do not reflect the deduction of any fees or expenses, transaction and/or custodial charges, the deduction of an investment management fee, nor the impact of taxes, the incurrence of which would have the effect of decreasing historical performance results. It should not be assumed that your account holdings correspond directly to any comparative indices and/or categories.
Index and Category Definitions
The S&P 500 Index is a capitalization-weighted index of 500 U.S. stocks. Russell 2000 TR USD is a market cap weighted index The Russell 2000 measuring the performance of approximately 2,000 smallest-cap American companies The MSCI All Country World ex-USA Index is a free float-adjusted market capitalization weighted index that is designed to measure the equity market performance of developed and emerging markets. The MSCI All Country World ex-USA Index consists of 22 developed and 24 emerging market country indices. The MSCI EAFE Index (Europe, Australasia, Far East) is a free float-adjusted market capitalization index that is designed to measure the equity market performance of developed markets, excluding the U.S. & Canada. The MSCI Emerging Markets (EM) Index is a free float-adjusted market capitalization index that is designed to measure equity market performance of 24 emerging markets countries. Bloomberg Barclays U.S. Aggregate Bond Index is an index of the U.S. investment-grade fixed-rate bond market, including both government and corporate bonds. ICE BofAML U.S. High Yield Index is an unmanaged index of below-investment grade U.S. corporate bonds. XZU Gold Spot $/Oz reflects the exchange rate of Gold against the US dollar index
Please note that nothing in this report post should be construed as an offer to sell or the solicitation of an offer to purchase an interest in any security or separate account. Nothing is intended to be, and you should not consider anything to be, investment, accounting, tax or legal advice. If you would like investment, accounting, tax or legal advice, you should consult with your own financial advisors, accountants, or attorneys regarding your individual circumstances and needs. Advice may only be provided by AtwoB after entering into an advisory agreement. Moreover, you should not assume that any discussion or information contained in this newsletter serves as the receipt of, or as a substitute for, personalized investment advice from AtwoB. If you are an AtwoB client, please remember to contact AtwoB, in writing, if there are any changes in your personal/financial situation or investment objectives for the purpose of reviewing/evaluating/revising our previous recommendations and/or services. AtwoB is neither a law firm nor a certified public accounting firm and no portion of the newsletter content should be construed as legal or accounting advice. A copy of the AtwoB’s current written disclosure Brochure discussing our advisory services and fees continues to remain available upon request.