
Big Picture and Key Takeaway
2nd Quarter 2023
(Click Here for Printable PDF)
Key Takeaway
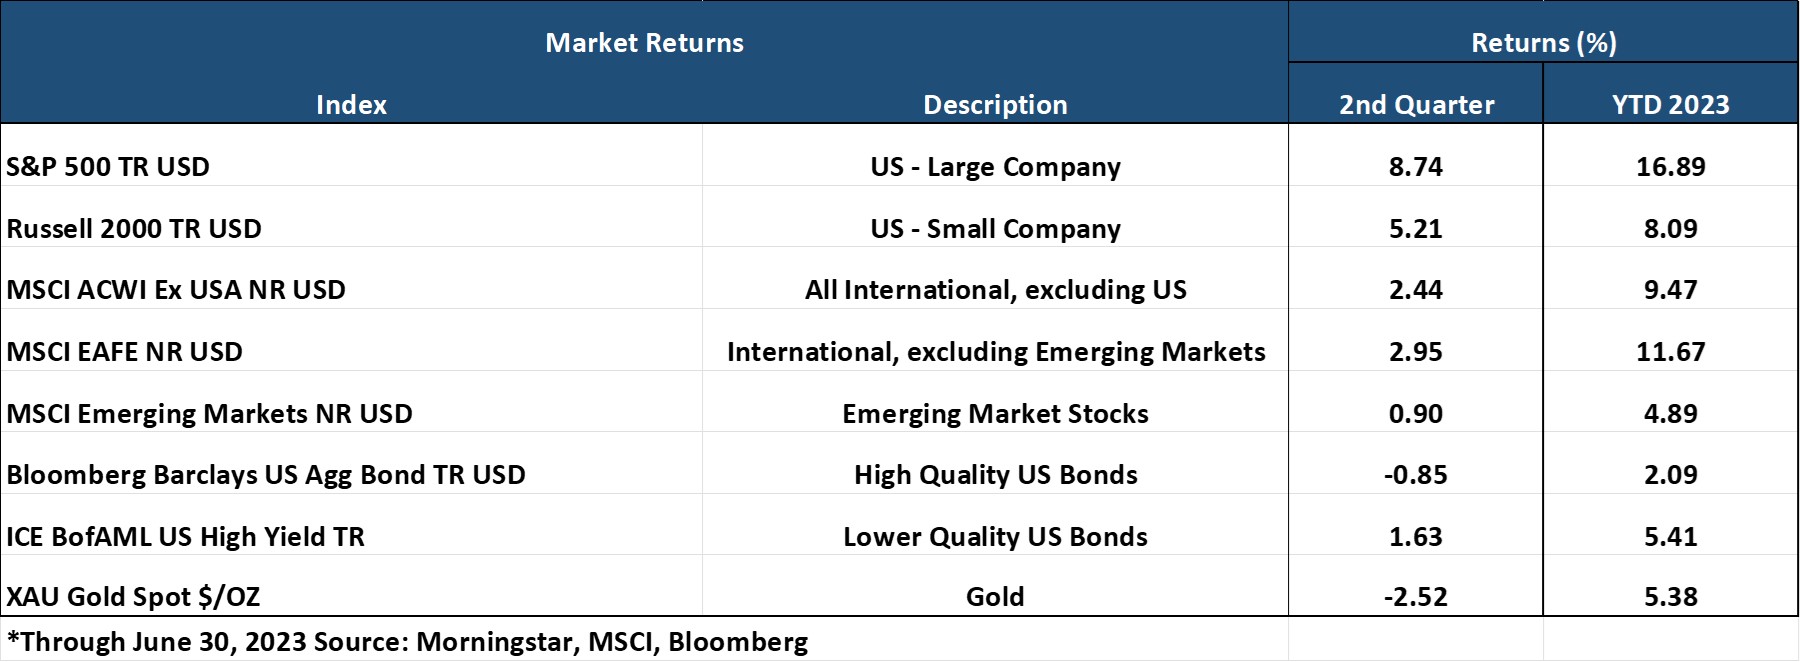
The global stock markets continued their resilient run in 2023 during the second quarter. U.S. Large cap stocks rallied (S&P500 +8.7%) on the back of a red-hot tech sector, which is recovering from a dismal 2022. In addition, during Q2 developed international stocks added to their positive returns for the year (MSCI EAFE +3.0%), albeit at a much slower pace than their U.S. counterparts. The broad-based bond market, however, struggled in the second quarter (AGG -0.8%) as interest rates rose on the backdrop of increasing expectations that the Federal Reserve would continue its monetary tightening campaign in the months ahead, despite a rate hike pause in June.
Notwithstanding the regional banking crisis and debt ceiling spectacle, the stock markets were lifted by generally favorable economic data, evidenced by a solid job market, better-than-expected corporate earnings, and decelerating headline inflation. While the sustainability of the “goldilocks” – not too hot, not too cold – economic narrative will likely remain under pressure, the lagged impact of the Fed’s rate increase cycle will increasingly come into focus. The stock markets, however, have seemed content to climb the proverbial “wall of worry” so far this year.
With expectations that the Federal Reserve will likely increase short-term interest rates over the next few months, the question for investors is how much of the good economic news has already been priced into the markets in the face of further tightening. Should the economy remain resilient and inflation continues to decelerate, the markets may continue to cheer as the probability of a "soft landing" for the economy increases. However, there will likely be headwinds should the economy slow down significantly and Core inflation remains above the Fed's 2% comfort zone. Currently, the stock markets seem to be anticipating the former outcome, but any shift in odds away from the soft-landing outcome may prove for more difficult sailing in the 2nd half of the year or into 2024.
The Big Picture
In general, the economic data painted a relatively stable picture during the second quarter as corporate earnings growth were modestly better than expected, job growth remained positive, and inflation continued to trend lower. The markets positively absorbed the economic data but will need to track whether conditions will require the Federal Reserve to continue its restrictive monetary policy to slow inflation further. Late in the quarter, Treasury bond rates from 2 to 10 years of maturity rose sharply, reflecting the Fed's financial tightening may still have some way to go.
INFLATION: Inflation continued to decelerate in June as the Bureau of Labor Statistics announced the Consumer Price Index for All Urban Consumers (CPI-U) increased 0.2% in June on a seasonally adjusted basis, and Core inflation (all items less food and energy) rose by 0.2% month over month. The year-over-year rates were 3.0% and 4.8%, respectively, from 4.0% and 5.3% in May. The headline number of 3% was the lowest year-over-year growth in the CPI-U since March 2021, while the Core number at 4.8% showed the lowest year-over-year growth rate since October 2021. Importantly, the cost of housing – which relies on rent prices in the calculation of the Consumer Price Index – has come down sharply and the trend is expected to continue in the coming months. Overall, Core inflation remains above the preferred 2% level of the Fed.
GROWTH (Gross Domestic Product): As the quarter ended, the Bureau of Economic Analysis reported that real (inflation-adjusted) gross domestic product (GDP) increased at an annual rate of 2.0% in the first quarter of 2023. In the fourth quarter, real GDP increased by 2.6%. The increase in real GDP in the first quarter reflected higher consumer spending, exports, state and local government spending, federal government spending, and nonresidential fixed investment which was partly offset by decreases in private inventory and residential fixed investment. Looking forward, inventory rebuilding may support growth, but weaker projected consumer and business spending may be a constraint in the months ahead. The Atlanta Fed's GDPNow model currently forecasts 2Q 2023 GDP growth of 2.1% (seasonally adjusted annual rate).
JOBS: In June, employers added 209,000 jobs, a drop from the revised 306,000 gain in May and slightly below expectations of a 225,000 gain. The unemployment rate dropped to 3.6% from 3.7% the previous month. Notably, the jobs reports did show the pace of wage growth, as measured by average hourly earnings, increased by a 4.4% year-over-year growth rate, which was higher than expected. Slower wage growth would help ease inflationary pressures in the economy, but these numbers do not likely change the projected trajectory of Fed rate hikes
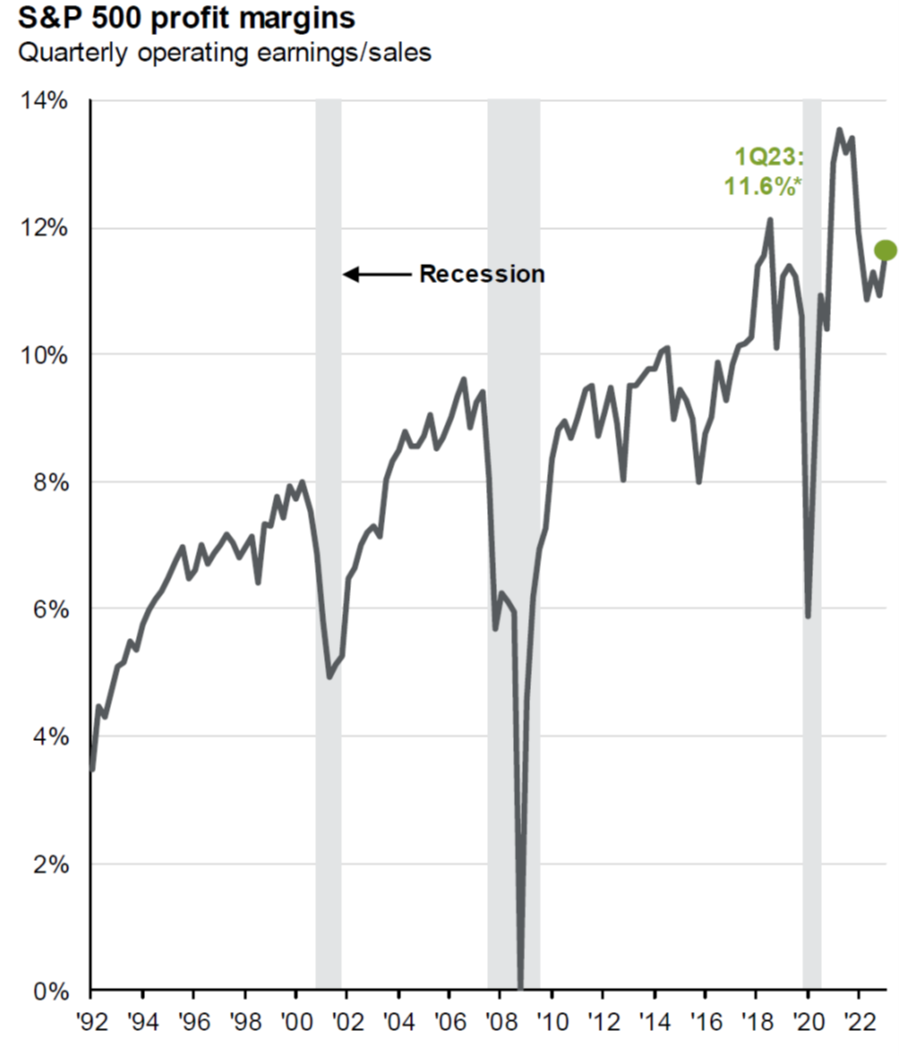
EARNINGS and ESTIMATES: The Q1 earnings season delivered better than expected results, as companies have successfully defended their profit margins. According to JP Morgan, the final estimate for S&P 500 1Q earnings per share is $52.54, representing year-over-year growth of 6.4% and quarter-over-quarter growth of 4.3%. In total, 70% of companies beat earnings expectations, 66% beat revenue expectations, while profit margins rose to 11.6% (see chart below).
As we look ahead to the 2nd quarter earnings season and the rest of the year, according to Factset, as of June 30th, the S&P 500 was expected to report a year-over-year earnings decline of -6.8%. If -6.8% is the actual year-over-year decline, it will mark the most significant earnings decline since the second quarter of 2020. It will also be the third straight quarter in which the S&P 500 has reported a year-over-year decrease in earnings. However, analysts still expect earnings growth for the second half of 2023. For Q3 2023 and Q4 2023, analysts are projecting year-over -year earnings growth of 0.4% and 7.9%, respectively.
RATES AND THE FED: At its June meeting, the Federal Reserve announced they would hold the official federal fund's target rate to the 5.00% to 5.25% range, the first pause after ten hikes in 14 months. However, the statement release language and post-release press conference from Jerome Powell were more hawkish, suggesting that the Fed would likely raise rates a couple more times to keep bringing inflation down. Currently, interest rate futures market are predicting a greater than 90% probability that the Fed will make another 0.25% increase at the July 26th meeting, and the market has shifted its outlook relative to earlier in the year expectations that rates would be lower by the end of the year.
Market Performance
Global Stocks
For the 2nd quarter, all 36 developed markets tracked by MSCI were positive. And of the 40 developing markets tracked by MSCI, 24 were also positive.
- In the U.S., large companies outperformed small ones for the quarter, and growth stocks beat value stocks, given the strong performance of large tech stocks. The top 10 holdings in the S&P 500, nearly all tech or communications services stocks, delivered 80% of the index's total return during the 1st half of 2023.
- 9 of the 11 S&P 500 sectors delivered positive quarterly returns, with three sectors higher by double-digits.
- The Technology, Communication Services, and Consumer Discretionary sectors performed best for the quarter, following up on an excellent 1st quarter.
- The Energy and Utilities sectors posted modest losses in the 2nd quarter of 2023.
- Developed international market stocks posted solid gains in the second quarter after a robust 1st quarter. The U.S. dollar appreciated modestly, a slight headwind to international developed stocks.
- Emerging Market stocks underperformed U.S. stocks and Developed International stocks for the quarter but posted a small positive return. India delivered a strong positive performance for the quarter, while China delivered a double-digit loss.
Bonds
The bond market's movement led to negative quarterly returns as interest rates increased during the quarter. As a result, the highlights include the following:
- The 10-year Treasury bond yield increased by 0.32% for the quarter, sending bond prices lower through June. The yield curve continued to invert further (from 2 years to 10 years), which has historically pointed to a recession on the horizon, but the usually reliable economic signal has been defied thus far.
- Treasury Inflation-Protected Securities delivered negative returns, as real interest rates increased and investors modestly decreased their expectations for future inflation throughout the quarter.
- Asset-Backed Securities outperformed most other bond market sectors for the quarter, given their lower sensitivity to interest rates.
- Credit spreads, a measure of the bond market's default risk, declined in the investment-grade and high yield sectors as investors demanded less compensation for assuming credit risk, consistent with the risk-embracing tone in the stock market. Once again, the highest credit quality bonds provided lower returns than lower credit quality bonds.
- The Municipal market delivered a modest negative return but outperformed its taxable bond market counterparts as investors continue to find higher yields attractive on an after-tax basis.
Important Disclosure Information
This report is provided as information and commentary regarding the market. The views expressed in this report are as of the date of the report, and are subject to change based on market and other conditions. This report contains certain statements that may be deemed forward-looking statements. Please note that any such statements are not guarantees of any future performance and actual results or developments may differ materially from those projected.
Please note that nothing in this report post should be construed as an offer to sell or the solicitation of an offer to purchase an interest in any security or separate account. Nothing is intended to be, and you should not consider anything to be, investment, accounting, tax or legal advice. If you would like investment, accounting, tax or legal advice, you should consult with your own financial advisors, accountants, or attorneys regarding your individual circumstances and needs. Advice may only be provided by AtwoB after entering into an investment advisory or financial planning agreement. Moreover, you should not assume that any discussion or information contained in this newsletter serves as the receipt of, or as a substitute for, personalized investment and/or planning advice from AtwoB. If you are an AtwoB client, please remember to contact AtwoB, in writing, if there are any changes in your personal/financial situation or investment objectives for the purpose of reviewing/evaluating/revising our previous recommendations and/or services.
Past performance is not a guarantee of future returns. Investing involves risk and possible loss of principal capital. Different types of investments involve varying degrees of risk, and there can be no assurance that the future performance of any specific investment, investment strategy, or product (including the investments and/or investment strategies recommended or undertaken by AtwoB, or any non-investment related content, made reference to directly or indirectly in this newsletter will be profitable, equal any corresponding indicated historical performance level(s), be suitable for your portfolio or individual situation, or prove successful. Historical performance results for investment indices and/or categories have been provided for general comparison purposes only, and generally do not reflect the deduction of any fees or expenses, transaction and/or custodial charges, the deduction of an investment management fee, nor the impact of taxes, the incurrence of which would have the effect of decreasing historical performance results. It should not be assumed that your account holdings correspond directly to any comparative indices and/or categories.
AtwoB is neither a law firm nor a certified public accounting firm and no portion of the newsletter content should be construed as legal or accounting advice. A copy of the AtwoB's current written disclosure Brochure discussing our advisory services and fees continues to remain available upon request.
Index and Category Definitions
The S&P 500 Index is a capitalization-weighted index of 500 U.S. stocks. Russell 2000 TR USD is a market cap weighted index The Russell 2000 measuring the performance of approximately 2,000 smallest-cap American companies The MSCI All Country World ex-USA Index is a free float-adjusted market capitalization weighted index that is designed to measure the equity market performance of developed and emerging markets. The MSCI All Country World ex-USA Index consists of 22 developed and 24 emerging market country indices. The MSCI EAFE Index (Europe, Australasia, Far East) is a free float-adjusted market capitalization index that is designed to measure the equity market performance of developed markets, excluding the U.S. & Canada. The MSCI Emerging Markets (E.M.) Index is a free float-adjusted market capitalization index that is designed to measure equity market performance of 24 emerging markets countries. Bloomberg Barclays U.S. Aggregate Bond Index ("AGG") is an index of the U.S. investment-grade fixed-rate bond market, including both government and corporate bonds. ICE BofAML U.S. High Yield Index is an unmanaged index of below-investment grade U.S. corporate bonds. XZU Gold Spot $/Oz reflects the exchange rate of Gold against the U.S. dollar index