
Big Picture and Key Takeaway
2nd Quarter 2025
(Click Here for Printable PDF)
Key Takeaway
Despite an increase in U.S. trade tariffs and a brief conflict in the Middle East, which created market volatility at the onset of the quarter, global financial markets delivered strong results in the second quarter of 2025. In early April, the White House announced a comprehensive tariff policy that brought significant uncertainty to the markets and triggered stocks to tumble amid fears of igniting stagflation and a recession,which resulted in the S&P 500 briefly falling over 20% from its February peak (a bear-market threshold).
However, sentiment quickly improved after officials temporarily froze some proposed tariffs and initiated negotiations by mid-April. By May and June, investors became more confident that the worst-case trade scenarios would be avoided, leading to a sharp rebound in the financial markets.
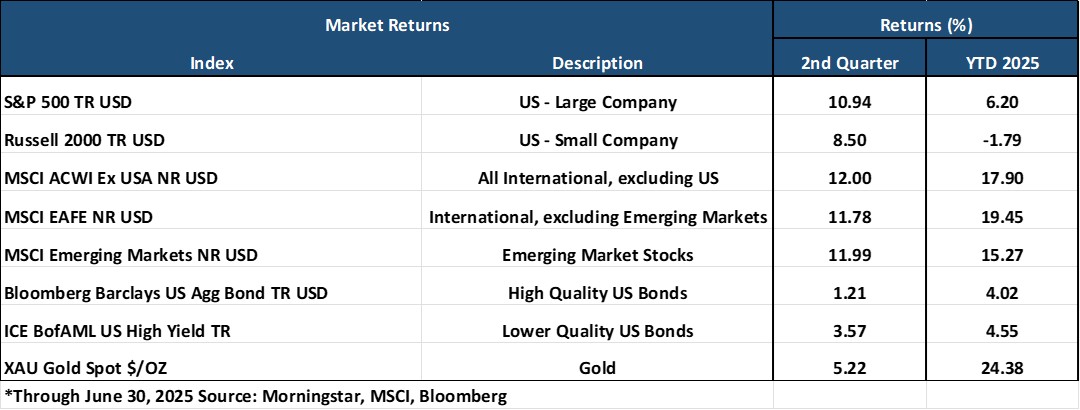
Leading the charge, U.S. large-cap stocks soared to new all-time highs (S&P 500 +11%), recovering from the sharp losses in April, while smaller U.S. companies rallied (R2000 +8.5%). In the overseas markets, developed international stocks (MSCI EAFE +11.8%) and emerging markets (MSCI EM +12%) both recorded double-digit quarterly gains, supported by lower valuations abroad and currency tailwinds as the dollar index fell to a multi-year low. The broad based bond market modestly improved (+1.2%), backed by stable interest rates and narrower credit spreads. Meanwhile, gold extended its rise (+5.2%) amid ongoing economic & geopolitical uncertainty, reaching record levels before settling near $3,300 per ounce.
Finally, toward the end of the quarter, Congress passed President Trump’s “one big, beautiful bill,” which would extend the majority of the 2017 tax cuts and reduce some uncertainty around taxes. That said, the newly enacted bill is likely to further expand deficits and exacerbate an already deteriorating U.S. fiscal situation. These concerns were highlighted by the Moody’s downgrade of the U.S. credit rating in May. Although challenges such as trade policy uncertainty, slowing growth, fiscal issues, and the threat of rising costs from tariffs linger, the quarter’s strong finish emphasizes the importance of staying invested.
The Big Picture
After a turbulent start to the quarter, triggered by sweeping new U.S. import tariffs and a sharp sell-off, markets and the economy found their footing. Key indicators now continue to point to a positive growth trajectory, albeit at a slower pace, and a labor market that is normalizing rather than cracking.
INFLATION: For June, the Bureau of Labor Statistics announced that the Consumer Price Index for All Urban Consumers (CPI-U) increased by 0.3% from May on a seasonally adjusted basis. Core inflation (all items less food and energy) rose by 0.2% month-over-month. The year-over-year rates were 2.7% (CPI-U) and 2.9% (Core), up from 2.4% and 2.8%, respectively, in May. Tariff-sensitive categories, including household furnishings, video and audio equipment, apparel, and toys, all experienced price increases from May.
GROWTH (Gross Domestic Product): According to the U.S. Bureau of Economic Analysis, Real Gross Domestic Product (GDP) contracted at an annual rate of -0.5% in the first quarter of 2025, marking the first quarterly decline since early 2022. The contraction was primarily driven by a significant increase in imports, which surged by 41.3%, subtracting nearly 4.8 percentage points from GDP. This surge in imports was largely due to businesses accelerating purchases ahead of anticipated tariffs. Additionally, federal government spending decreased by 4.6%, the largest drop since 2022, further contributing to the decline. Looking ahead to the 2nd quarter release, the Federal Reserve Bank of Atlanta's GDPNow forecasting model predicts an annualized growth increase of 2.6%.
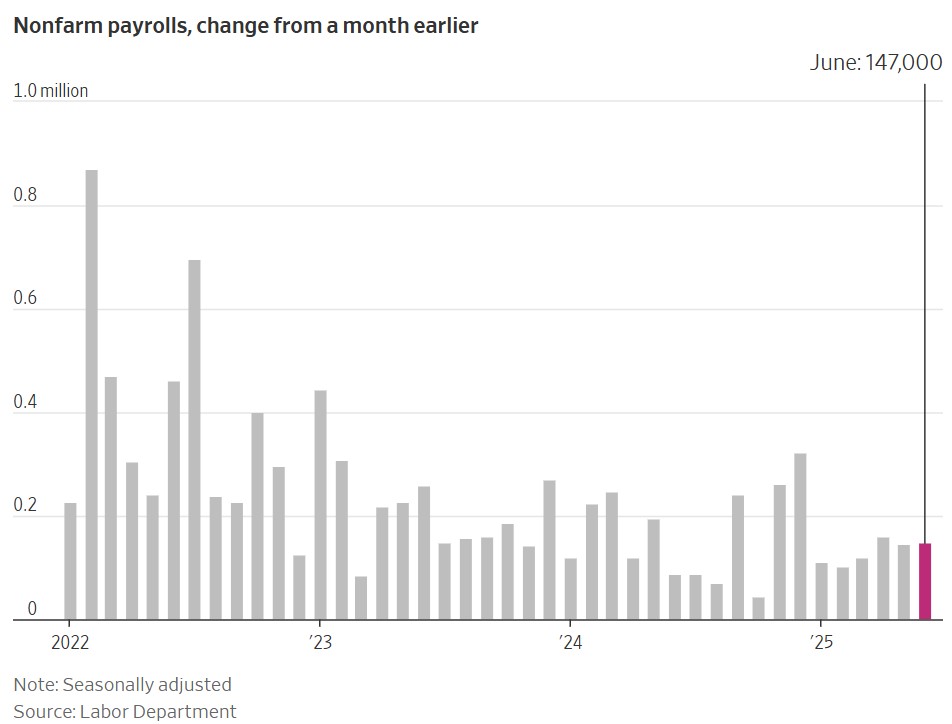
JOBS: The June jobs report showed that U.S. employers added 147,000 jobs during the month, while the unemployment rate dropped to 4.1% from 4.2% the month before. Most of the job growth was in the Government, Education, and Healthcare sectors, while hiring in other private sectors stayed steady. The overall labor force shrank as fewer workers looked for jobs, and more people who had been unemployed for over six months were counted, indicating it is taking longer for job seekers to find work. The latest employment report also noted modestly slowing wage growth, with wages rising by 3.7% year-over-year, continuing the trend of slower wage increases.
EARNINGS and ESTIMATES: As of June 30th, research firm FactSet reported that for Q2 2025, analysts have lowered the bottom-up EPS (earnings per share) estimate for the S&P 500 by 4.1% (to $62.86 from $65.55) from March 31 to June 30. The estimated year-over-year earnings growth rate is 5.0%. If this estimate holds, it would represent the lowest earnings growth for the index since the fourth quarter of 2023, when it was 4.0%. All eleven sectors within the index are now projected to report lower earnings than previously expected, due to downward revisions in earnings-per-share (EPS) estimates. Meanwhile, the forward 12-month price-to-earnings (P/E) ratio for the index stands at 21.9. This valuation is higher than both the 5-year average of 19.9 and the 10-year average of 18.4, indicating relatively elevated market expectations.
RATES AND THE FED: The Federal Reserve held the Fed Funds Rate steady at 4.25 – 4.50% throughout Q2, choosing to “wait and see” how tariffs and a slower growth affect the economy. June projections still include two ¼-point cuts in 2025, down from the four expected in April, although a growing number of policymakers favor just one. In remarks after the Federal Open Market Committee meeting, Chair Jerome Powell reaffirmed the Fed’s commitment to its inflation goal, stressing that policymakers need “greater confidence that inflation is moving sustainably toward 2 percent” before considering any further rate cuts, and the Committee is “prepared to maintain current restriction as long as appropriate.”
Market Performance
Global Stocks
For the 2nd quarter, 23 of the 24 developed markets tracked by MSCI were positive. And of the 38 developing markets tracked by MSCI, 35 were also positive.
- In the U.S., large companies outperformed small companies for the quarter, and growth stocks beat value stocks. 8 of the 11 S&P 500 sectors delivered a positive return.
- The Information Technology sector performed best for the quarter, followed by Communications Services and Industrials
- The Energy, Healthcare and Real Estate sectors posted negative returns.
- Developed and emerging market international stocks posted strong gains in the second quarter. The outperformance was partially attributed to a sharp decline in the U.S. dollar, a tailwind for international stock performance, and more attractive valuation levels.
- Korea, Greece, and Mexico were the largest winning markets overseas, with gains exceeding 20%, while China and India posted more modest positive returns.
Bonds
The bond market posted a positive quarterly return as bond interest rates held steady. The highlights include the following:
- The 10-year Treasury bond yield increased by 0.02% for the quarter, leading to a positive return in U.S. Treasuries from the income produced during the quarter.
- Treasury Inflation-Protected Securities increased modestly but underperformed standard Treasuries as inflation expectations declined modestly from the end of March.
- U.S. mortgage-backed and asset-backed securities performed in-line with most other fixed-income sectors as their high credit quality and attractive valuations remain attractive to fixed income investors.
- Credit spreads, a measure of the bond market's default risk, decreased for the quarter. The lowest credit quality bonds outperformed relative to higher credit quality bonds, the former of which have higher income payments due to their inferior credit quality.
- The Municipal market underperformed its taxable bond market counterparts, as yields on municipal bonds actually increased, as opposed to remaining steady like equivalent-maturity Treasury Bonds.
Important Disclosure Information
This report is provided as information and commentary regarding the market. The views expressed in this report are as of the date of the report, and are subject to change based on market and other conditions. This report contains certain statements that may be deemed forward-looking statements. Please note that any such statements are not guarantees of any future performance and actual results or developments may differ materially from those projected.
Please note that nothing in this report post should be construed as an offer to sell or the solicitation of an offer to purchase an interest in any security or separate account. Nothing is intended to be, and you should not consider anything to be, investment, accounting, tax or legal advice. If you would like investment, accounting, tax or legal advice, you should consult with your own financial advisors, accountants, or attorneys regarding your individual circumstances and needs. Advice may only be provided by AtwoB after entering into an investment advisory or financial planning agreement. Moreover, you should not assume that any discussion or information contained in this newsletter serves as the receipt of, or as a substitute for, personalized investment and/or planning advice from AtwoB. If you are an AtwoB client, please remember to contact AtwoB, in writing, if there are any changes in your personal/financial situation or investment objectives for the purpose of reviewing/evaluating/revising our previous recommendations and/or services.
Past performance is not a guarantee of future returns. Investing involves risk and possible loss of principal capital. Different types of investments involve varying degrees of risk, and there can be no assurance that the future performance of any specific investment, investment strategy, or product (including the investments and/or investment strategies recommended or undertaken by AtwoB, or any non-investment related content, made reference to directly or indirectly in this newsletter will be profitable, equal any corresponding indicated historical performance level(s), be suitable for your portfolio or individual situation, or prove successful. Historical performance results for investment indices and/or categories have been provided for general comparison purposes only, and generally do not reflect the deduction of any fees or expenses, transaction and/or custodial charges, the deduction of an investment management fee, nor the impact of taxes, the incurrence of which would have the effect of decreasing historical performance results. It should not be assumed that your account holdings correspond directly to any comparative indices and/or categories.
AtwoB is neither a law firm nor a certified public accounting firm and no portion of the newsletter content should be construed as legal or accounting advice. A copy of the AtwoB's current written disclosure Brochure discussing our advisory services and fees continues to remain available upon request.
Index and Category Definitions
The S&P 500 Index is a capitalization-weighted index of 500 U.S. stocks. Russell 2000 TR USD is a market cap weighted index The Russell 2000 measuring the performance of approximately 2,000 smallest-cap American companies The MSCI All Country World ex-USA Index is a free float-adjusted market capitalization weighted index that is designed to measure the equity market performance of developed and emerging markets. The MSCI All Country World ex-USA Index consists of 22 developed and 24 emerging market country indices. The MSCI EAFE Index (Europe, Australasia, Far East) is a free float-adjusted market capitalization index that is designed to measure the equity market performance of developed markets, excluding the U.S. & Canada. The MSCI Emerging Markets (E.M.) Index is a free float-adjusted market capitalization index that is designed to measure equity market performance of 24 emerging markets countries. Bloomberg Barclays U.S. Aggregate Bond Index is an index of the U.S. investment-grade fixed-rate bond market, including both government and corporate bonds. ICE BofAML U.S. High Yield Index is an unmanaged index of below-investment grade U.S. corporate bonds. XZU Gold Spot $/Oz reflects the exchange rate of Gold against the U.S. dollar index.