

Big Picture and Key Takeaway
2nd Quarter 2026
(Click Here for Printable PDF)
Key Takeaway
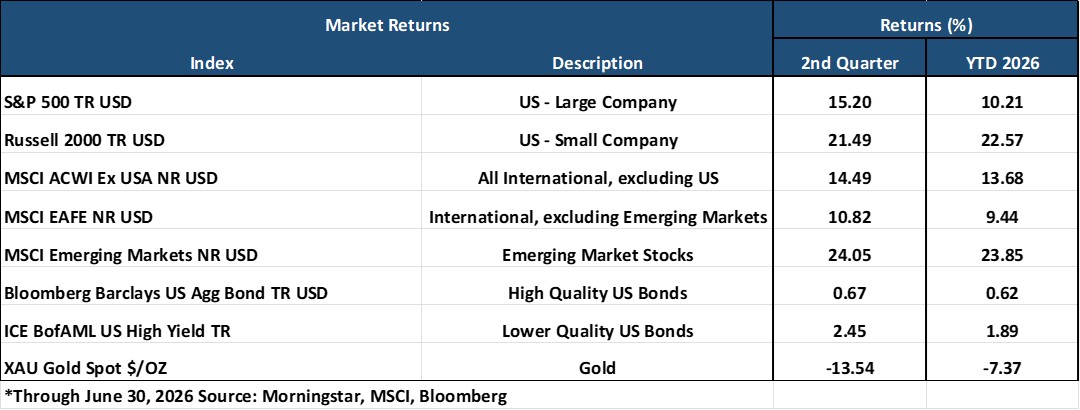
The second quarter of 2026 saw some of the strongest performances in both U.S. and global equity markets since the 2Q 2020 post-pandemic rebound. Markets recovered significantly as tensions between the U.S. and Iran eased, thus reducing disruptions in global energy markets. Consequently, oil prices dropped sharply, and investors shifted their focus back to steady corporate earnings and artificial intelligence (AI).
For the quarter:
U.S. large-cap stocks rose (S&P 500, +15.2%), while smaller U.S. companies posted even stronger gains (R2000, +21.5%). The rally broadened significantly as the quarter progressed. Early gains were concentrated among mega-cap growth and technology stocks, but small-cap and value benchmarks reached new record highs by quarter's end.
International developed (MSCI EAFE, +10.9%) and emerging markets (MSCI EM, +24.0%) also increased, with emerging markets leading the way, despite a stronger dollar.
U.S. bonds were up modestly (AGG, +0.7%) as interest rates remain “higher for longer” amid renewed inflation fears.
Gold (-13.5%) fell from roughly $4,700 per ounce at the start of the quarter to under $4,030 by quarter-end — its worst quarterly performance in 13 years
The rise in risk sentiment faced some challenges. Although growth and technology stocks led initially in the quarter, a hawkish message from the new Fed Chair, Kevin Warsh, along with ongoing high inflation fueled further from the Iran conflict, caused volatility in rate-sensitive and communication/technology stocks - even as cyclical and defensive sectors regained leadership in June.
The third quarter opens with investors balancing renewed geo-political tensions against an uncertain Fed policy environment. Although the easing of Middle East tensions has alleviated pressure on global energy markets and boosted investor confidence, the threat of a geopolitical flare-up persists, especially highlighted by the fragility of the Iran ceasefire, which is already in question in July. Furthermore, inflation remains above the Federal Reserve’s long-term target, and monetary policy will likely stay restrictive until consistent progress is seen in lowering prices. While corporate earnings and ongoing investments in AI infrastructure continue to support markets, high equity valuations and inflation could make them more vulnerable to economic and geo-political surprises.
The Big Picture
The second quarter’s market themes were continued economic and earnings growth being weighed against the threat of persistently higher inflation and tighter monetary policy.
INFLATION: For June 2026, the Consumer Price Index for All Urban Consumers (CPI-U) fell by 0.4% on a seasonally adjusted basis from the prior month. Over the past 12 months, inflation has risen by 3.5%, a cool-down from May’s annual pace of 4.2%, the highest in 3 years. The core CPI (all items excluding food and energy) was flat in June from May and was up 2.6% year-over-year. One reason inflation moderated last month was that gas prices fell sharply in June. Overall, the price of gas fell 9.7 percent. While the cooler numbers are welcome news for the Fed, this reprieve in prices may be short-lived. The price of gasoline has already risen slightly from last week as renewed fighting in Iran has disrupted supply.
GROWTH (Gross Domestic Product): The U.S. Bureau of Economic Analysis (BEA) latest estimate showed real GDP grew by 2.1% annualized in Q1 2026. In Q4 2025, real GDP increased by 0.5%. The growth in Q1 was driven by higher investment, exports, government spending, and consumer expenditures. Additionally, the Federal Reserve Bank of Atlanta’s GDPNow model projected a real GDP growth of approximately 1.2% (seasonally adjusted annual rate) for the second quarter as of early July.
JOBS: The June employment report showed only 57,000 new jobs, far below the 113,000 economists had forecast. Several factors contributed to the weak June job growth, including a 61,000 decrease in leisure and hospitality roles, counter to expectations of World Cup-related hiring. Ongoing declines in federal government positions, which have fallen by 69,000 since January, also contributed to the weaker reading. Despite the slowdown, the unemployment rate decreased slightly to 4.2%. Average hourly earnings increased by just 3.5% year-over-year in June, below the 4.2% inflation rate from May. As a result, many workers face reduced purchasing power after years of strong inflation-adjusted wage increases.
EARNINGS and ESTIMATES: Expectations for corporate earnings significantly improved in the second quarter. FactSet reported that the projected year-over-year earnings growth for S&P 500 companies increased to 23.3% by the end of the quarter, up from 18.8% at the start (March 31). This is unusual, since analysts normally lower earnings estimates during a quarter (by an average of 2.7% over the past decade) rather than raise them. If confirmed, 23.3% growth would represent the second straight quarter of over 20% earnings growth and the seventh consecutive quarter of double-digit year-over-year earnings increases.
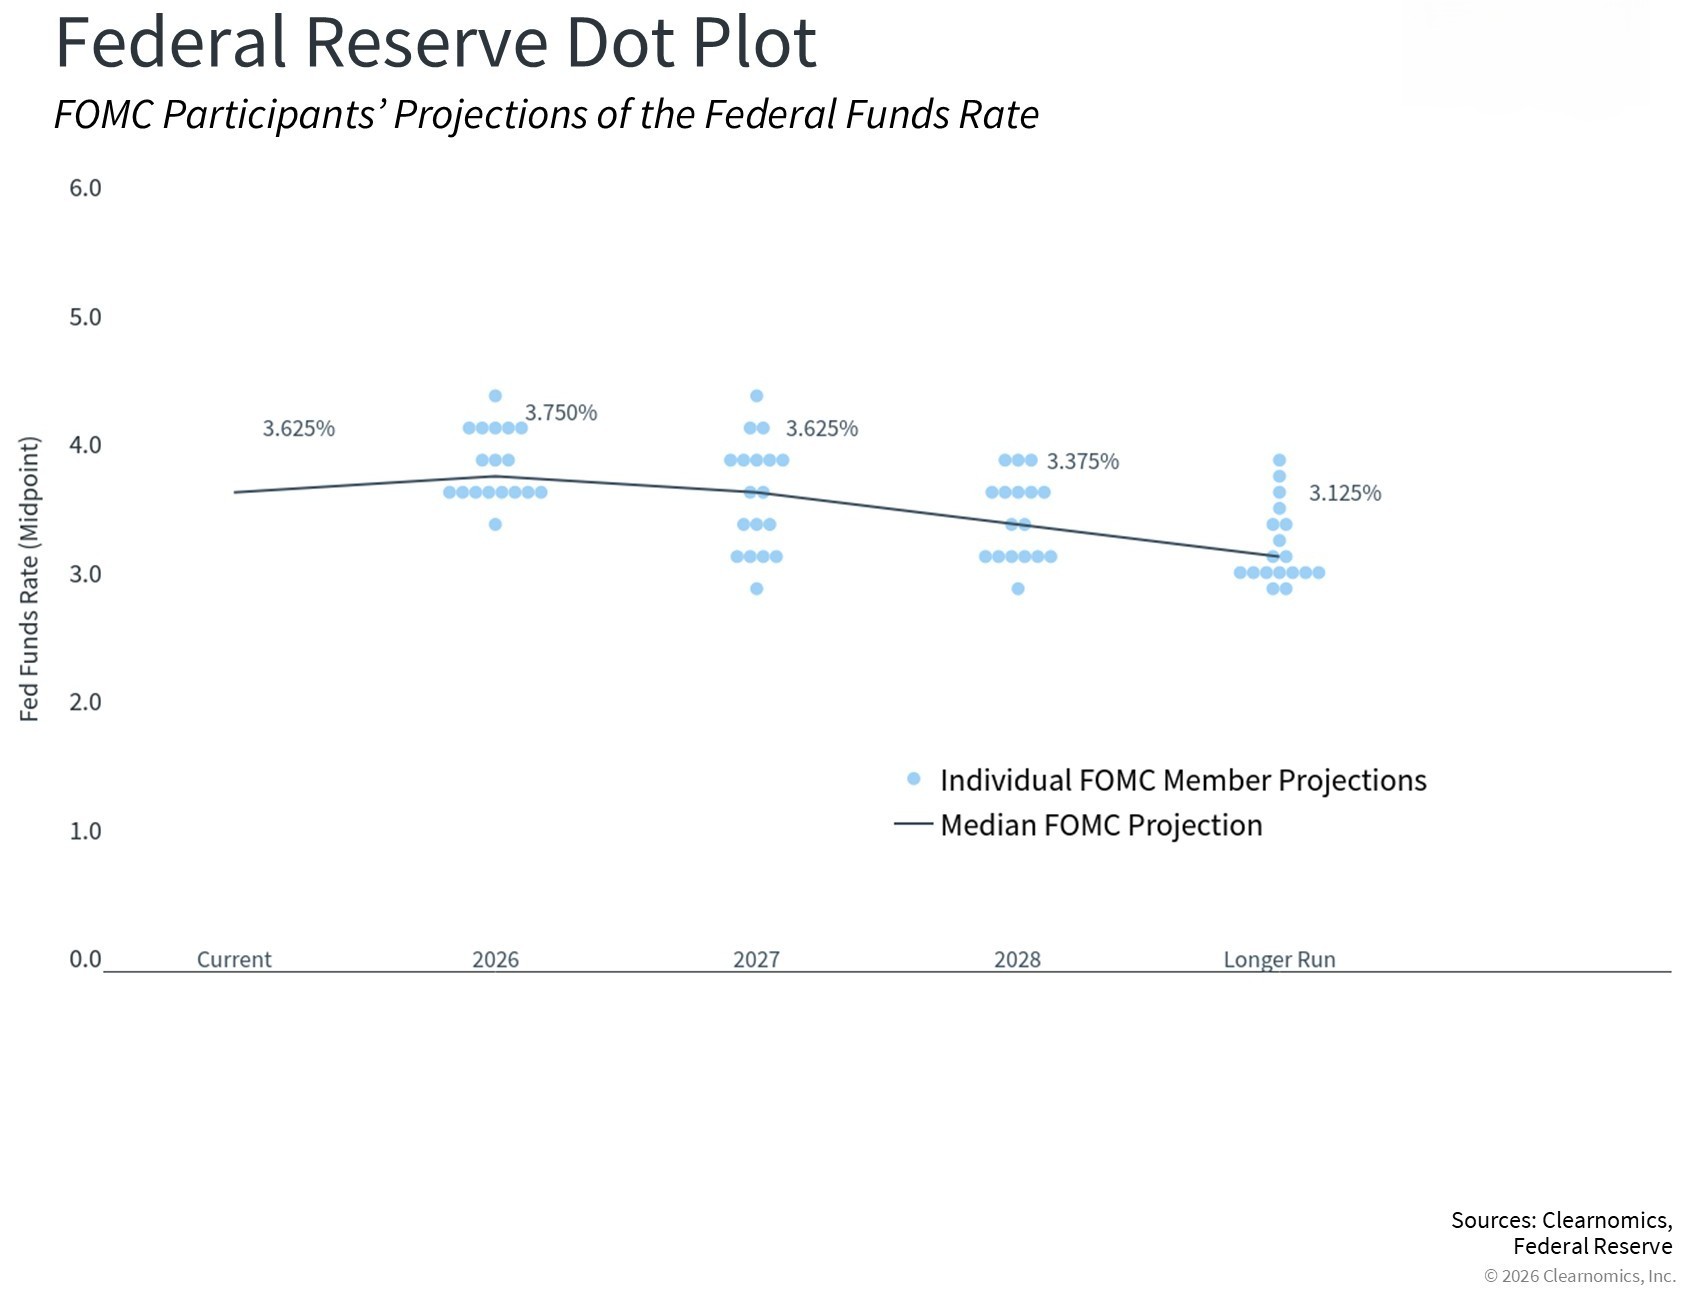
RATES AND THE FED: The quarter signaled a shift at the Federal Reserve, with Kevin Warsh confirmed by the Senate on May 13, 2026, to lead as Chairman. He presided over his first FOMC meeting on June 17, during which the Committee kept the benchmark rate steady at 3.50%–3.75%. The latest Fed “Dot Plot,” which indicates individual Fed members projections of the Fed Funds Rate in the future, shows most participants now expect a rate increase rather than a cut before the end of 2026, with cuts then resuming in 2027 and beyond (see chart). Inflation remained a key concern. In the post-meeting press conference, Chairman Warsh addressed the Fed's inflation mandate directly: "Persistently high prices are a burden for the American people, but the recent past need not be prologue. I am pleased to report that members of the FOMC are unambiguous and unanimous — this committee will deliver price stability."
Market Performance
Global Stocks
Global equity markets delivered strong positive returns for the second quarter, with emerging markets and US small-cap stocks outperforming their U.S. and developed international large-cap counterparts.
- In the U.S., small companies outperformed large companies for the quarter, and growth stocks beat value stocks.
- Nine of the eleven S&P 500 sectors delivered positive returns.
- Energy posted the worst return for the quarter by a wide margin due to lower oil prices, with Utilities also posting a modest negative return.
- Information Technology rebounded to post the best return among all sectors, followed by Industrials.
- Despite a stronger dollar, international developed market investors underperformed the U.S. for the quarter but still posted a double-digit return.
- Emerging markets had an excellent quarter and outperformed the U.S. and other developed markets, on the back of very strong performance from Korea and Taiwan, and despite negative returns from China.
Bonds
The bond market posted a modest but positive quarterly return as yields increased, with income more than offsetting modest price declines. The highlights include:
- Although the 10-year Treasury bond yield increased by 0.12% for the quarter, overall, U.S. Treasuries had a small positive return.
- Treasury Inflation-Protected Securities gained and outperformed standard Treasuries as inflation expectations increased from the end of March.
- U.S. mortgage-backed securities performed in-line with most other fixed-income sectors for the quarter as their high credit quality and attractive valuations, especially compared to corporate bonds, remain attractive to fixed-income investors.
- Credit spreads, a measure of the bond market's default risk, declined for the quarter. The highest-credit-quality bonds underperformed lower-credit-quality bonds, which have higher income payments due to their lower credit quality.
The Municipal market outperformed its taxable bond market counterparts, as yields on municipal bonds decreased, while equivalent-maturity Treasury Bonds yields increased.
Important Disclosure Information
This report is provided as information and commentary regarding the market. The views expressed in this report are as of the date of the report, and are subject to change based on market and other conditions. This report contains certain statements that may be deemed forward-looking statements. Please note that any such statements are not guarantees of any future performance and actual results or developments may differ materially from those projected.
Please note that nothing in this report post should be construed as an offer to sell or the solicitation of an offer to purchase an interest in any security or separate account. Nothing is intended to be, and you should not consider anything to be, investment, accounting, tax or legal advice. If you would like investment, accounting, tax or legal advice, you should consult with your own financial advisors, accountants, or attorneys regarding your individual circumstances and needs. Advice may only be provided by AtwoB after entering into an investment advisory or financial planning agreement. Moreover, you should not assume that any discussion or information contained in this newsletter serves as the receipt of, or as a substitute for, personalized investment and/or planning advice from AtwoB. If you are an AtwoB client, please remember to contact AtwoB, in writing, if there are any changes in your personal/financial situation or investment objectives for the purpose of reviewing/evaluating/revising our previous recommendations and/or services.
Past performance is not a guarantee of future returns. Investing involves risk and possible loss of principal capital. Different types of investments involve varying degrees of risk, and there can be no assurance that the future performance of any specific investment, investment strategy, or product (including the investments and/or investment strategies recommended or undertaken by AtwoB, or any non-investment related content, made reference to directly or indirectly in this newsletter will be profitable, equal any corresponding indicated historical performance level(s), be suitable for your portfolio or individual situation, or prove successful. Historical performance results for investment indices and/or categories have been provided for general comparison purposes only, and generally do not reflect the deduction of any fees or expenses, transaction and/or custodial charges, the deduction of an investment management fee, nor the impact of taxes, the incurrence of which would have the effect of decreasing historical performance results. It should not be assumed that your account holdings correspond directly to any comparative indices and/or categories.
AtwoB is neither a law firm nor a certified public accounting firm and no portion of the newsletter content should be construed as legal or accounting advice. A copy of the AtwoB's current written disclosure Brochure discussing our advisory services and fees continues to remain available upon request.
Index and Category Definitions
The S&P 500 Index is a capitalization-weighted index of 500 U.S. stocks. Russell 2000 TR USD is a market cap weighted index The Russell 2000 measuring the performance of approximately 2,000 smallest-cap American companies The MSCI All Country World ex-USA Index is a free float-adjusted market capitalization weighted index that is designed to measure the equity market performance of developed and emerging markets. The MSCI All Country World ex-USA Index consists of 22 developed and 24 emerging market country indices. The MSCI EAFE Index (Europe, Australasia, Far East) is a free float-adjusted market capitalization index that is designed to measure the equity market performance of developed markets, excluding the U.S. & Canada. The MSCI Emerging Markets (E.M.) Index is a free float-adjusted market capitalization index that is designed to measure equity market performance of 24 emerging markets countries. Bloomberg Barclays U.S. Aggregate Bond Index is an index of the U.S. investment-grade fixed-rate bond market, including both government and corporate bonds. ICE BofAML U.S. High Yield Index is an unmanaged index of below-investment grade U.S. corporate bonds. XZU Gold Spot $/Oz reflects the exchange rate of Gold against the U.S. dollar index.