

Big Picture and Key Takeaway
3rd Quarter 2026
(Click Here for Printable PDF)
Key Takeaway
Two major themes shaped the third quarter. On one hand, interest rates climbed to their highest levels in over two decades, which sometimes is a headwind for stocks. Meanwhile, corporate earnings continued to grow at a strong pace, largely thanks to AI-related investments, helping the S&P 500 reach new all-time highs.
For the quarter and year-to-date periods:
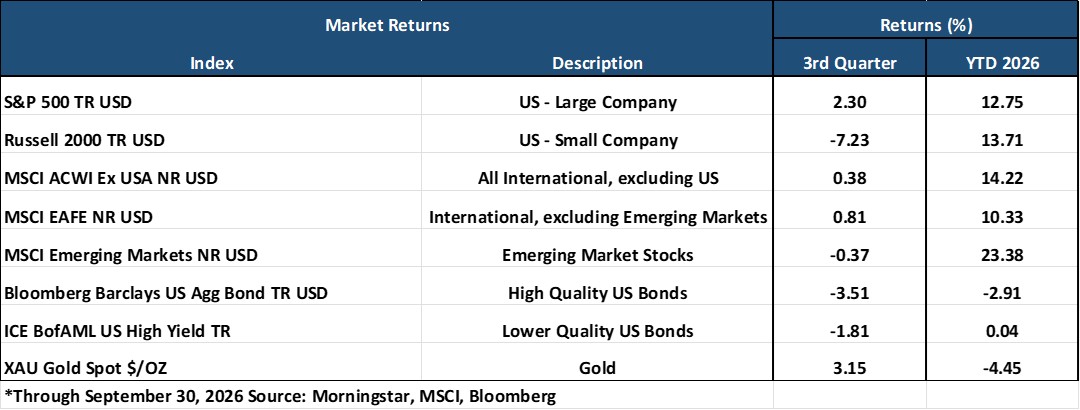
U.S. large-cap stocks rose (S&P 500, +2.3% QTR, +12.8% YTD), while smaller U.S. companies posted losses for the quarter as they have more sensitivity to higher interest rates (R2000, -7.2% QTR, +13.7 YTD).
International developed (MSCI EAFE, +0.8% QTR, +10.3 YTD) and emerging market (MSCI EM, -0.4% QTR, +23.4% YTD) returns were mixed for the quarter, with a stronger dollar lowering returns on overseas markets.
Higher bond interest rates have been a challenge for bond prices across the entire yield curve, with US bonds (AGG, -3.5% QTR, -2.9 YTD) down for the quarter and year so far.
Gold (+3.2% QTR, -4.5 YTD) rebounded modestly in the third quarter, following its worst quarterly performance in 13 years, and remained down modestly for the year.
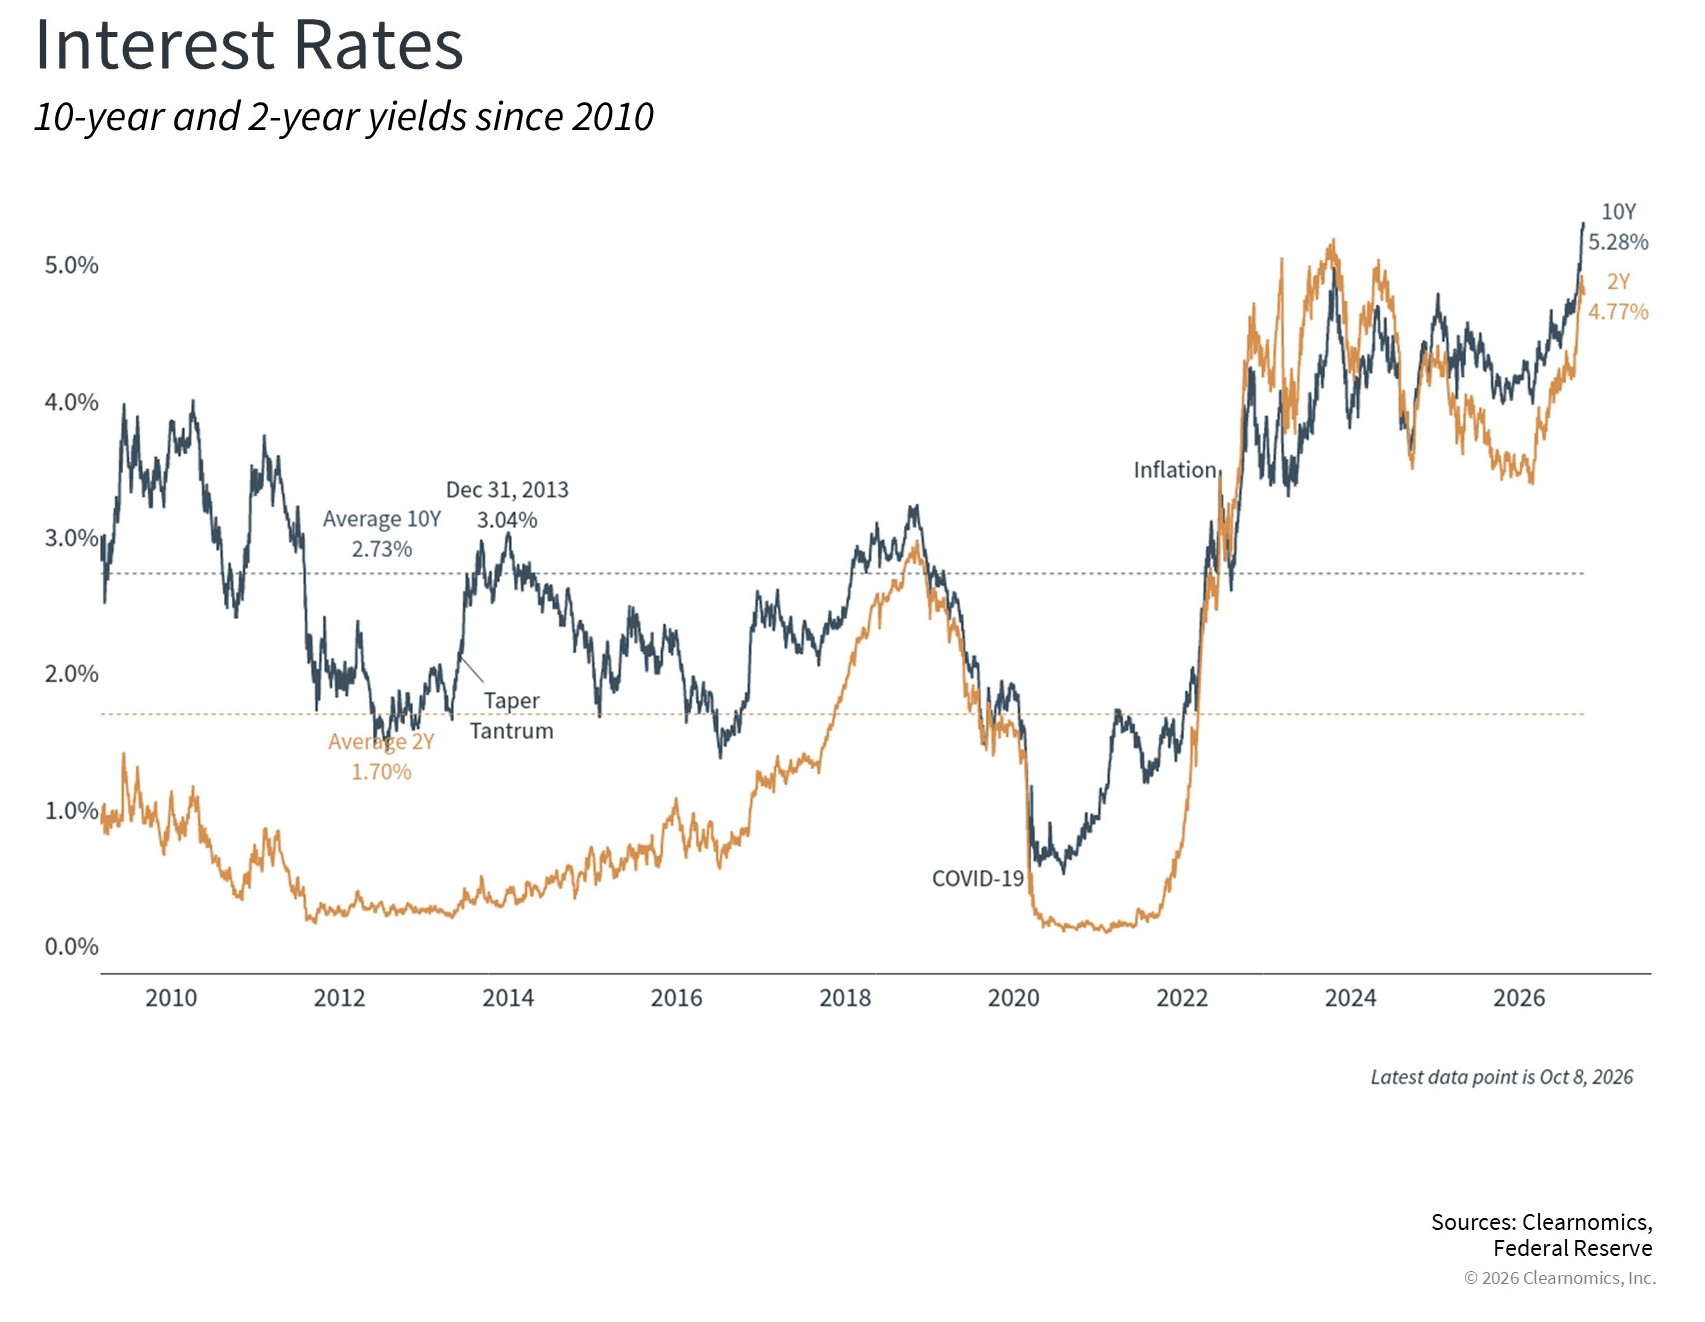
For many years after the 2008 financial crisis, low interest rates shaped the investment landscape, providing low-cost capital to businesses and individuals. In recent years, however, that trend has reversed. The 10-year Treasury yield, which drives mortgage interest and other consumer rates, ended the third quarter near 5.3%, its highest level in about 20 years. Several factors likely contributed to higher rates, including stronger-than-expected economic growth and inflation, as well as concerns about the long-term fiscal positions of the U.S. and other developed countries. The Federal Reserve also increased its key policy rate for the first time in three years and may also hike rates towards the end of the year.
Perhaps the most important driver of the stock market rally this year is corporate earnings. In the long run, the stock market tends to follow the path of corporate profits. Current forecasts suggest that earnings for the S&P 500 are expected to grow around 30% this year, which would be well above the historical average of around 8%. According to Goldman Sachs, AI has been responsible for nearly 50% of S&P 500 earnings growth in 2026.
Historically, rising interest rates and rising stock markets can coexist, particularly when the economy and corporate earnings are healthy. So far, 2026 has provided a good example: a broad range of asset classes have provided positive returns this year despite a challenging stretch for bonds. While bonds have struggled lately, their yields are now substantially higher than in previous decades - a potentially significant development for investors, who may want to de-risk out of stocks to earn higher yields. As we enter the final months of the year, the themes that shaped the third quarter and the year—interest rates, oil prices, the pace of AI investment, geopolitical tensions, and the midterm elections—will likely remain in focus.
The Big Picture
Interest rates were one of the big stories of the quarter, with the 10-year Treasury yield touching 5.30% in September (see chart), a level not seen since 2002. Unlike 2022, when rates climbed largely due to runaway inflation (hurting stocks and bonds at the same time), today's increases are being driven primarily by rising real (inflation-adjusted) yields – reflecting economic growth.
INFLATION: For September 2026, the Consumer Price Index for All Urban Consumers (CPI-U) rose by 0.6% on a seasonally adjusted basis from the prior month, the largest monthly increase in 5 months. Over the past 12 months, inflation rose 3.7%. The core CPI (all items excluding food and energy) increased in September from August by 0.3% and was up 2.6% year-over-year. Much of the increase came directly from energy prices, which have risen sharply this year because of the war with Iran. Gasoline prices rose to their highest level in four months in late September, at nearly $4.50 a gallon, and surged 9.1 percent for the month.
GROWTH (Gross Domestic Product): According to the U.S. Bureau of Economic Analysis (BEA), Real GDP grew at a 2.2% annualized rate in the second quarter, up from 1.5% in the previous estimate. First-quarter growth was also revised higher to 2.5%. Consumer spending, investment, and exports contributed to the second-quarter increase. Additionally, the Federal Reserve Bank of Atlanta’s GDPNow model projected strong real GDP growth of approximately 3.7% (seasonally adjusted annual rate) for the third quarter as of early October.
JOBS: The September jobs report showed nonfarm payrolls rose just 29,000, well below expectations of 90,000. Additionally, prior months were revised down by a combined 60,000 jobs. This means August's initially reported 162,000 figure was weaker than previously believed, at 133,000 jobs. The unemployment rate ticked up to 4.2%, while the "under-employment" rate fell slightly to 7.6%. These moves reflect a rise in the labor force participation rate to 61.8%. This could be positive because it means more workers are participating in the workforce, an early reversal of the past year's trend.
EARNINGS and ESTIMATES: As of early October, FactSet's year-over-year earnings growth rate for the S&P 500 is 29.5%. If 29.5% is the actual quarterly growth rate, it marks the index's third straight quarter of earnings growth above 25%. All 11 S&P 500 sectors have reported year-over-year earnings growth, with five in double digits, led by Energy, Information Technology, Communication Services, and Materials. The S&P 500 is also expected to report (year-over-year) revenue growth of 12.3%, compared to the expectations for revenue growth of 10.9% on June 30. The forward 12-month P/E ratio for the S&P 500 is 19.0. This P/E ratio is below the 5-year average (19.8) and below the 10-year average (19.1).
RATES AND THE FED: On September 16, the Committee voted unanimously to raise the Fed Funds Rate range to 3.75%–4.00%, marking its first increase since 2023. The statement said, “Inflation remains elevated,” and explained that the move would support a timelier return to the 2% goal. The decision reflected stronger economic growth, steady labor-market conditions, and insufficient progress on inflation. At his press conference, Chair Kevin Warsh said, “This summer’s inflation readings do not tell me that underlying trends have meaningfully improved.” The Fed also released its new Summary of Economic Projections, which shows that FOMC members expect one additional rate hike this year and, perhaps most importantly, that rates may not fall again until 2028.
Market Performance
Global Stocks
Global equity markets delivered mixed returns for the third quarter, with US large-cap stocks outperforming their U.S. small and international counterparts.
In the U.S., large companies outperformed small companies for the quarter, and value stocks beat growth stocks.
Seven of the eleven S&P 500 sectors delivered negative returns.
Energy posted the best return for the quarter by a wide margin due to higher oil prices, with Information Technology also posting a strong positive return.
Industrials, Utilities, and the interest rate-sensitive real estate sector posted the lowest returns.
A stronger dollar led international developed markets to underperform the U.S. for the quarter but still posted a small positive return.
Emerging markets underperformed the U.S. and other developed markets, with negative performance from Korea, India, and China offsetting positive performance in Latin America and Europe.
Bonds
The bond market posted a negative quarterly return as yields rose sharply, driving price declines. The highlights include:
The 10-year Treasury bond yield increased sharply by 0.83% for the quarter to 5.27%, leading U.S. Treasuries to a negative return.
Treasury Inflation-Protected Securities modestly outperformed standard Treasuries as inflation expectations increased from the end of July but still posted declines.
U.S. mortgage-backed securities underperformed most other fixed-income sectors for the quarter as higher rates reduced refinancing activity, causing mortgage bonds to extend the time it takes for investors to get paid back.
Credit spreads, a measure of the bond market's default risk, increased for the quarter. The highest-credit-quality bonds underperformed lower-credit-quality bonds, which have higher income payments due to their lower credit quality.
The Municipal market underperformed its taxable bond market counterparts, as yields on municipal bonds increased more than equivalent-maturity Treasury Bond yields increased.